| Business / Energy Data |
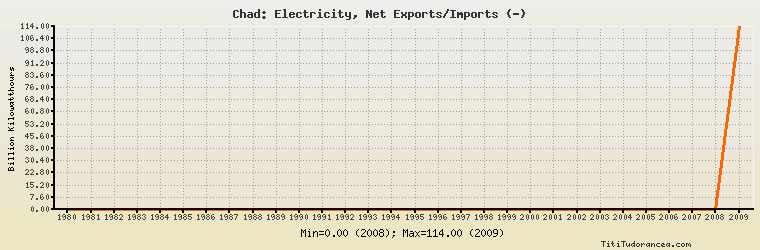
Chad: Electricity, Net Exports/Imports (-)
Billion Kilowatthours
| Year | Chad | Change, percent | Chad, percent of Africa | Chad, percent of World |
| 1980 | 0.003 | N/A | - | N/A |
| 1981 | 0.003 | 0.000% | - | N/A |
| 1982 | 0.003 | 0.000% | -33.333% | N/A |
| 1983 | 0.003 | 0.000% | -1.079% | N/A |
| 1984 | 0.003 | 0.000% | -5.882% | N/A |
| 1985 | 0.004 | 33.333% | - | N/A |
| 1986 | 0.005 | 25.000% | -4.348% | N/A |
| 1987 | 0.006 | 20.000% | -3.000% | N/A |
| 1988 | 0.005 | -16.667% | -1.866% | N/A |
| 1989 | 0.005 | 0.000% | -5.102% | N/A |
| 1990 | 0.006 | 20.000% | -1.230% | N/A |
| 1991 | 0.006 | 0.000% | -2.564% | N/A |
| 1992 | 0.006 | 0.000% | 4.054% | N/A |
| 1993 | 0.006 | 0.000% | -11.765% | N/A |
| 1994 | 0.006 | 0.000% | -4.762% | N/A |
| 1995 | 0.006 | 0.000% | 1.319% | N/A |
| 1996 | 0.006 | 0.000% | 0.338% | N/A |
| 1997 | 0.006 | 0.000% | 0.380% | N/A |
| 1998 | 0.006 | 0.000% | -0.170% | N/A |
| 1999 | 0.006 | 0.000% | -0.244% | N/A |
| 2000 | 0.006 | 0.000% | -0.160% | N/A |
| 2001 | 0.006 | 0.000% | -0.218% | N/A |
| 2002 | 0.006 | 0.000% | -0.330% | N/A |
| 2003 | 0.006 | 0.000% | -0.191% | N/A |
| 2004 | 0.006 | 0.000% | -0.366% | N/A |
| 2005 | 0.007 | 16.667% | -0.316% | N/A |
| 2006 | 0.007 | 0.000% | -0.172% | N/A |
| 2007 | 0.007 | 0.000% | -0.153% | N/A |
| 2008 | 0.000 | -100.000% | 0.00% | N/A |
| 2009 | 114.000 | 0.000% | -2,645.012% | N/A |
Historical Energy Data about Chad
Total Oil Supply
Total Consumption of Petroleum Products
Oil and Petroleum Products, Net Exports/Imports (-)
Production of Crude Oil including Lease Condensate
Crude Oil Proved Reserves
Dry Natural Gas, Net Exports/Imports (-)
Coal, Net Exports/Imports (-)
Total Electricity Net Generation
Total Electricity Net Consumption
Electricity, Net Exports/Imports (-)
Total Conventional Thermal Electricity Net Generation
Total Primary Energy Production
Total Primary Energy Consumption
Total Carbon Dioxide Emissions from the Consumption of Energy
Population