| Business / Energy Data |
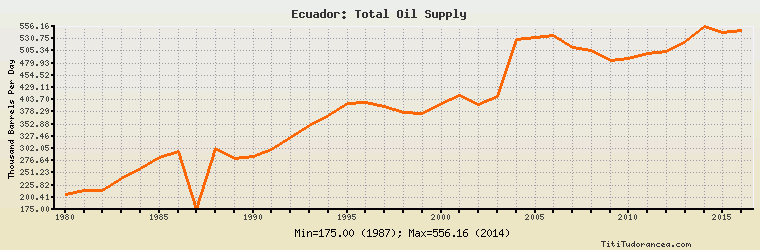
Ecuador: Total Oil Supply
Thousand Barrels Per Day
| Year | Ecuador | Change, percent | Ecuador, percent of Central & South America | Ecuador, percent of World |
| 1980 | 207.000 | N/A | 5.378% | 0.323% |
| 1981 | 214.000 | 3.382% | 5.545% | 0.353% |
| 1982 | 214.000 | 0.000% | 5.814% | 0.368% |
| 1983 | 240.000 | 12.150% | 6.529% | 0.414% |
| 1984 | 261.000 | 8.750% | 6.715% | 0.438% |
| 1985 | 284.000 | 8.812% | 7.252% | 0.480% |
| 1986 | 295.000 | 3.873% | 7.127% | 0.479% |
| 1987 | 175.000 | -40.678% | 4.296% | 0.282% |
| 1988 | 303.000 | 73.143% | 7.019% | 0.471% |
| 1989 | 281.000 | -7.261% | 6.432% | 0.429% |
| 1990 | 286.000 | 1.779% | 6.082% | 0.430% |
| 1991 | 301.000 | 5.245% | 6.076% | 0.454% |
| 1992 | 324.000 | 7.641% | 6.421% | 0.487% |
| 1993 | 349.000 | 7.716% | 6.591% | 0.520% |
| 1994 | 370.000 | 6.017% | 6.524% | 0.539% |
| 1995 | 396.000 | 7.027% | 6.471% | 0.563% |
| 1996 | 398.000 | 0.505% | 6.097% | 0.553% |
| 1997 | 389.000 | -2.261% | 5.540% | 0.524% |
| 1998 | 377.000 | -3.085% | 5.297% | 0.498% |
| 1999 | 374.000 | -0.796% | 5.340% | 0.500% |
| 2000 | 396.311 | 5.966% | 5.419% | 0.510% |
| 2001 | 412.511 | 4.088% | 5.715% | 0.531% |
| 2002 | 392.719 | -4.798% | 5.668% | 0.509% |
| 2003 | 411.342 | 4.742% | 6.154% | 0.517% |
| 2004 | 529.006 | 28.605% | 7.530% | 0.634% |
| 2005 | 532.755 | 0.709% | 7.356% | 0.626% |
| 2006 | 536.380 | 0.680% | 7.352% | 0.630% |
| 2007 | 511.422 | -4.653% | 7.034% | 0.600% |
| 2008 | 505.269 | -1.203% | 6.728% | 0.583% |
| 2009 | 485.707 | -3.872% | 6.286% | 0.566% |
| 2010 | 488.886 | 0.655% | 6.219% | 0.554% |
| 2011 | 498.980 | 2.065% | 6.205% | 0.562% |
| 2012 | 503.396 | 0.885% | 6.299% | 0.555% |
| 2013 | 525.916 | 4.474% | 6.487% | 0.576% |
| 2014 | 556.162 | 5.751% | 6.626% | 0.593% |
| 2015 | 542.898 | -2.385% | 6.326% | 0.561% |
| 2016 | 548.225 | 0.981% | 6.627% | 0.564% |
Historical Energy Data about Ecuador
Total Oil Supply
Total Consumption of Petroleum Products
Oil and Petroleum Products, Net Exports/Imports (-)
Production of Crude Oil including Lease Condensate
Crude Oil Proved Reserves
Dry Natural Gas Production
Dry Natural Gas Consumption
Dry Natural Gas, Net Exports/Imports (-)
Proved Reserves of Natural Gas
Total Coal Consumption
Coal, Net Exports/Imports (-)
Total Recoverable Coal
Total Electricity Net Generation
Total Electricity Net Consumption
Total Electricity Exports
Total Electricity Imports
Electricity, Net Exports/Imports (-)
Total Conventional Thermal Electricity Net Generation
Hydroelectricity Net Generation
Total Biofuels Production
Total Primary Energy Production
Total Primary Energy Consumption
Total Carbon Dioxide Emissions from the Consumption of Energy
Population