| Business / Energy Data |
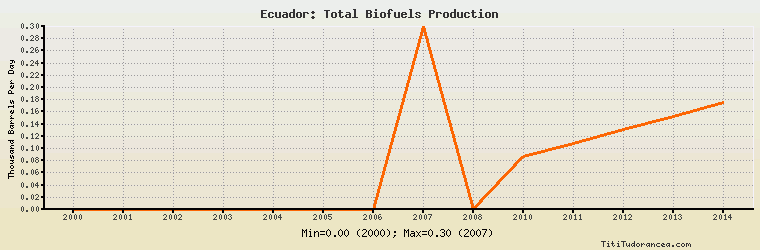
Ecuador: Total Biofuels Production
Thousand Barrels Per Day
| Year | Ecuador | Change, percent | Ecuador, percent of Central & South America | Ecuador, percent of World |
| 2000 | 0.000 | N/A | 0.00% | 0.00% |
| 2001 | 0.000 | 0.000% | 0.00% | 0.00% |
| 2002 | 0.000 | 0.000% | 0.00% | 0.00% |
| 2003 | 0.000 | 0.000% | 0.00% | 0.00% |
| 2004 | 0.000 | 0.000% | 0.00% | 0.00% |
| 2005 | 0.000 | 0.000% | 0.00% | 0.00% |
| 2006 | 0.000 | 0.000% | 0.00% | 0.00% |
| 2007 | 0.300 | 0.000% | 0.070% | 0.027% |
| 2008 | 0.000 | -100.000% | 0.00% | 0.00% |
| 2009 | N/A | N/A | N/A | N/A |
| 2010 | 0.087 | N/A | 0.017% | N/A |
| 2011 | 0.109 | 25.287% | 0.023% | N/A |
| 2012 | 0.131 | 20.183% | 0.026% | N/A |
| 2013 | 0.153 | 16.794% | 0.027% | N/A |
| 2014 | 0.175 | 14.379% | 0.030% | N/A |
Historical Energy Data about Ecuador
Total Oil Supply
Total Consumption of Petroleum Products
Oil and Petroleum Products, Net Exports/Imports (-)
Production of Crude Oil including Lease Condensate
Crude Oil Proved Reserves
Dry Natural Gas Production
Dry Natural Gas Consumption
Dry Natural Gas, Net Exports/Imports (-)
Proved Reserves of Natural Gas
Total Coal Consumption
Coal, Net Exports/Imports (-)
Total Recoverable Coal
Total Electricity Net Generation
Total Electricity Net Consumption
Total Electricity Exports
Total Electricity Imports
Electricity, Net Exports/Imports (-)
Total Conventional Thermal Electricity Net Generation
Hydroelectricity Net Generation
Total Biofuels Production
Total Primary Energy Production
Total Primary Energy Consumption
Total Carbon Dioxide Emissions from the Consumption of Energy
Population