| Business / Energy Data |
Barbados: Total Biofuels Production
Thousand Barrels Per Day
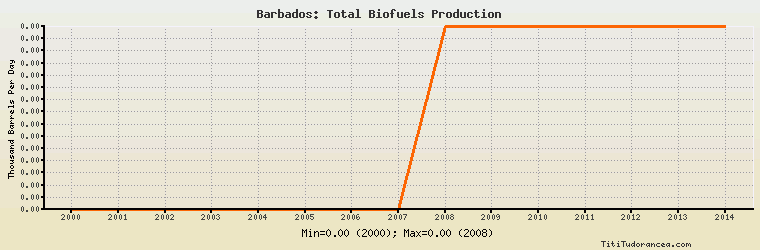
| Year | Barbados | Change, percent | Barbados, percent of Central & South America | Barbados, percent of World |
| 2000 | 0.000 | N/A | 0.00% | 0.00% |
| 2001 | 0.000 | 0.000% | 0.00% | 0.00% |
| 2002 | 0.000 | 0.000% | 0.00% | 0.00% |
| 2003 | 0.000 | 0.000% | 0.00% | 0.00% |
| 2004 | 0.000 | 0.000% | 0.00% | 0.00% |
| 2005 | 0.000 | 0.000% | 0.00% | 0.00% |
| 2006 | 0.000 | 0.000% | 0.00% | 0.00% |
| 2007 | 0.000 | 0.000% | 0.00% | 0.00% |
| 2008 | 0.001 | 0.000% | 0.000% | 0.000% |
| 2009 | 0.001 | 0.000% | 0.000% | N/A |
| 2010 | 0.001 | 0.000% | 0.000% | N/A |
| 2011 | 0.001 | 0.000% | 0.000% | N/A |
| 2012 | 0.001 | 0.000% | 0.000% | N/A |
| 2013 | 0.001 | 0.000% | 0.000% | N/A |
| 2014 | 0.001 | 0.000% | 0.000% | N/A |
Historical Energy Data about Barbados
Total Oil Supply
Total Consumption of Petroleum Products
Oil and Petroleum Products, Net Exports/Imports (-)
Production of Crude Oil including Lease Condensate
Crude Oil Proved Reserves
Dry Natural Gas Production
Dry Natural Gas Consumption
Dry Natural Gas, Net Exports/Imports (-)
Proved Reserves of Natural Gas
Coal, Net Exports/Imports (-)
Total Electricity Net Generation
Total Electricity Net Consumption
Electricity, Net Exports/Imports (-)
Total Conventional Thermal Electricity Net Generation
Total Biofuels Production
Total Primary Energy Production
Total Primary Energy Consumption
Total Carbon Dioxide Emissions from the Consumption of Energy
Population