| Business / Energy Data |
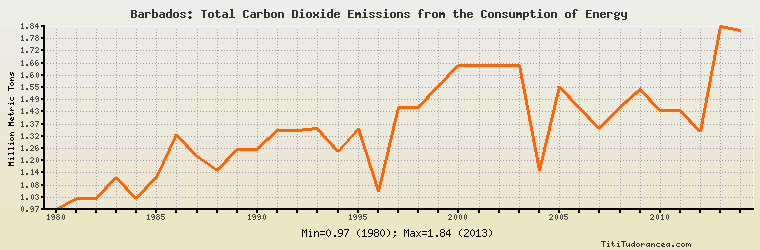
Barbados: Total Carbon Dioxide Emissions from the Consumption of Energy
Million Metric Tons
| Year | Barbados | Change, percent | Barbados, percent of Central & South America | Barbados, percent of World |
| 1980 | 0.968 | N/A | 0.155% | 0.005% |
| 1981 | 1.019 | 5.269% | 0.165% | 0.006% |
| 1982 | 1.019 | 0.000% | 0.166% | 0.006% |
| 1983 | 1.122 | 10.108% | 0.189% | 0.006% |
| 1984 | 1.022 | -8.913% | 0.166% | 0.005% |
| 1985 | 1.122 | 9.785% | 0.181% | 0.006% |
| 1986 | 1.322 | 17.825% | 0.197% | 0.007% |
| 1987 | 1.219 | -7.791% | 0.178% | 0.006% |
| 1988 | 1.152 | -5.496% | 0.167% | 0.005% |
| 1989 | 1.253 | 8.767% | 0.176% | 0.006% |
| 1990 | 1.253 | 0.000% | 0.174% | 0.006% |
| 1991 | 1.344 | 7.263% | 0.183% | 0.006% |
| 1992 | 1.343 | -0.074% | 0.182% | 0.006% |
| 1993 | 1.353 | 0.745% | 0.173% | 0.006% |
| 1994 | 1.243 | -8.130% | 0.153% | 0.006% |
| 1995 | 1.351 | 8.689% | 0.157% | 0.006% |
| 1996 | 1.053 | -22.058% | 0.117% | 0.005% |
| 1997 | 1.453 | 37.987% | 0.154% | 0.006% |
| 1998 | 1.453 | 0.000% | 0.151% | 0.006% |
| 1999 | 1.553 | 6.882% | 0.159% | 0.007% |
| 2000 | 1.653 | 6.439% | 0.166% | 0.007% |
| 2001 | 1.653 | 0.000% | 0.163% | 0.007% |
| 2002 | 1.653 | 0.000% | 0.165% | 0.007% |
| 2003 | 1.653 | 0.000% | 0.163% | 0.006% |
| 2004 | 1.153 | -30.248% | 0.109% | 0.004% |
| 2005 | 1.553 | 34.692% | 0.141% | 0.006% |
| 2006 | 1.453 | -6.439% | 0.127% | 0.005% |
| 2007 | 1.353 | -6.882% | 0.116% | 0.005% |
| 2008 | 1.453 | 7.391% | 0.120% | 0.005% |
| 2009 | 1.539 | 5.919% | 0.129% | 0.005% |
| 2010 | 1.436 | -6.693% | 0.110% | 0.005% |
| 2011 | 1.439 | 0.209% | 0.108% | 0.004% |
| 2012 | 1.336 | -7.158% | 0.097% | 0.004% |
| 2013 | 1.836 | 37.425% | 0.129% | 0.005% |
| 2014 | 1.818 | -0.980% | 0.125% | 0.005% |
Historical Energy Data about Barbados
Total Oil Supply
Total Consumption of Petroleum Products
Oil and Petroleum Products, Net Exports/Imports (-)
Production of Crude Oil including Lease Condensate
Crude Oil Proved Reserves
Dry Natural Gas Production
Dry Natural Gas Consumption
Dry Natural Gas, Net Exports/Imports (-)
Proved Reserves of Natural Gas
Coal, Net Exports/Imports (-)
Total Electricity Net Generation
Total Electricity Net Consumption
Electricity, Net Exports/Imports (-)
Total Conventional Thermal Electricity Net Generation
Total Biofuels Production
Total Primary Energy Production
Total Primary Energy Consumption
Total Carbon Dioxide Emissions from the Consumption of Energy
Population