| Business / Energy Data |
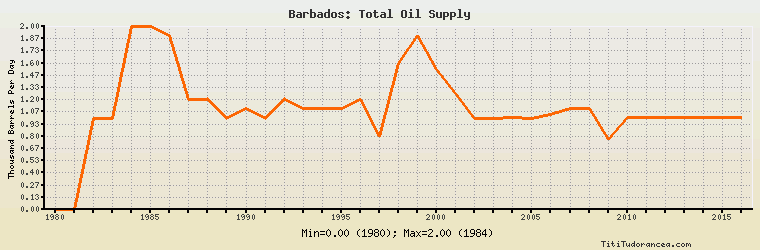
Barbados: Total Oil Supply
Thousand Barrels Per Day
| Year | Barbados | Change, percent | Barbados, percent of Central & South America | Barbados, percent of World |
| 1980 | 0.000 | N/A | 0.00% | 0.00% |
| 1981 | 0.000 | 0.000% | 0.00% | 0.00% |
| 1982 | 1.000 | 0.000% | 0.027% | 0.002% |
| 1983 | 1.000 | 0.000% | 0.027% | 0.002% |
| 1984 | 2.000 | 100.000% | 0.051% | 0.003% |
| 1985 | 2.000 | 0.000% | 0.051% | 0.003% |
| 1986 | 1.900 | -5.000% | 0.046% | 0.003% |
| 1987 | 1.200 | -36.842% | 0.029% | 0.002% |
| 1988 | 1.200 | 0.000% | 0.028% | 0.002% |
| 1989 | 1.000 | -16.667% | 0.023% | 0.002% |
| 1990 | 1.100 | 10.000% | 0.023% | 0.002% |
| 1991 | 1.000 | -9.091% | 0.020% | 0.002% |
| 1992 | 1.200 | 20.000% | 0.024% | 0.002% |
| 1993 | 1.100 | -8.333% | 0.021% | 0.002% |
| 1994 | 1.100 | 0.000% | 0.019% | 0.002% |
| 1995 | 1.100 | 0.000% | 0.018% | 0.002% |
| 1996 | 1.200 | 9.091% | 0.018% | 0.002% |
| 1997 | 0.800 | -33.333% | 0.011% | 0.001% |
| 1998 | 1.600 | 100.000% | 0.022% | 0.002% |
| 1999 | 1.900 | 18.750% | 0.027% | 0.003% |
| 2000 | 1.530 | -19.474% | 0.021% | 0.002% |
| 2001 | 1.271 | -16.928% | 0.018% | 0.002% |
| 2002 | 1.000 | -21.322% | 0.014% | 0.001% |
| 2003 | 1.000 | 0.000% | 0.015% | 0.001% |
| 2004 | 1.002 | 0.200% | 0.014% | 0.001% |
| 2005 | 1.000 | -0.200% | 0.014% | 0.001% |
| 2006 | 1.034 | 3.400% | 0.014% | 0.001% |
| 2007 | 1.108 | 7.157% | 0.015% | 0.001% |
| 2008 | 1.101 | -0.632% | 0.015% | 0.001% |
| 2009 | 0.766 | -30.427% | 0.010% | 0.001% |
| 2010 | 1.001 | 30.679% | 0.013% | 0.001% |
| 2011 | 1.001 | 0.000% | 0.012% | 0.001% |
| 2012 | 1.001 | 0.000% | 0.013% | 0.001% |
| 2013 | 1.001 | 0.000% | 0.012% | 0.001% |
| 2014 | 1.001 | 0.000% | 0.012% | 0.001% |
| 2015 | 1.001 | 0.000% | 0.012% | 0.001% |
| 2016 | 1.001 | 0.000% | 0.012% | 0.001% |
Historical Energy Data about Barbados
Total Oil Supply
Total Consumption of Petroleum Products
Oil and Petroleum Products, Net Exports/Imports (-)
Production of Crude Oil including Lease Condensate
Crude Oil Proved Reserves
Dry Natural Gas Production
Dry Natural Gas Consumption
Dry Natural Gas, Net Exports/Imports (-)
Proved Reserves of Natural Gas
Coal, Net Exports/Imports (-)
Total Electricity Net Generation
Total Electricity Net Consumption
Electricity, Net Exports/Imports (-)
Total Conventional Thermal Electricity Net Generation
Total Biofuels Production
Total Primary Energy Production
Total Primary Energy Consumption
Total Carbon Dioxide Emissions from the Consumption of Energy
Population