| Business / Energy Data |
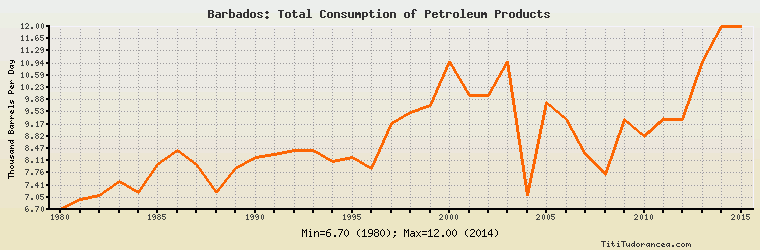
Barbados: Total Consumption of Petroleum Products
Thousand Barrels Per Day
| Year | Barbados | Change, percent | Barbados, percent of Central & South America | Barbados, percent of World |
| 1980 | 6.700 | N/A | 0.203% | 0.011% |
| 1981 | 7.000 | 4.478% | 0.197% | 0.011% |
| 1982 | 7.100 | 1.429% | 0.208% | 0.012% |
| 1983 | 7.500 | 5.634% | 0.232% | 0.013% |
| 1984 | 7.200 | -4.000% | 0.221% | 0.012% |
| 1985 | 8.000 | 11.111% | 0.248% | 0.013% |
| 1986 | 8.400 | 5.000% | 0.243% | 0.014% |
| 1987 | 8.000 | -4.762% | 0.224% | 0.013% |
| 1988 | 7.200 | -10.000% | 0.199% | 0.011% |
| 1989 | 7.900 | 9.722% | 0.218% | 0.012% |
| 1990 | 8.200 | 3.797% | 0.218% | 0.012% |
| 1991 | 8.300 | 1.220% | 0.216% | 0.012% |
| 1992 | 8.400 | 1.205% | 0.213% | 0.012% |
| 1993 | 8.400 | 0.000% | 0.206% | 0.012% |
| 1994 | 8.100 | -3.571% | 0.190% | 0.012% |
| 1995 | 8.200 | 1.235% | 0.183% | 0.012% |
| 1996 | 7.900 | -3.659% | 0.169% | 0.011% |
| 1997 | 9.200 | 16.456% | 0.187% | 0.013% |
| 1998 | 9.500 | 3.261% | 0.188% | 0.013% |
| 1999 | 9.700 | 2.105% | 0.187% | 0.013% |
| 2000 | 11.000 | 13.402% | 0.208% | 0.014% |
| 2001 | 10.000 | -9.091% | 0.188% | 0.013% |
| 2002 | 10.000 | 0.000% | 0.191% | 0.013% |
| 2003 | 11.000 | 10.000% | 0.212% | 0.014% |
| 2004 | 7.100 | -35.455% | 0.131% | 0.009% |
| 2005 | 9.800 | 38.028% | 0.175% | 0.012% |
| 2006 | 9.300 | -5.102% | 0.160% | 0.011% |
| 2007 | 8.300 | -10.753% | 0.140% | 0.010% |
| 2008 | 7.700 | -7.229% | 0.132% | 0.009% |
| 2009 | 9.300 | 20.779% | 0.150% | 0.011% |
| 2010 | 8.800 | -5.376% | 0.133% | 0.010% |
| 2011 | 9.300 | 5.682% | 0.138% | 0.010% |
| 2012 | 9.300 | 0.000% | 0.132% | 0.010% |
| 2013 | 11.000 | 18.280% | 0.155% | 0.012% |
| 2014 | 12.000 | 9.091% | 0.165% | 0.013% |
| 2015 | 12.000 | 0.000% | 0.166% | 0.013% |
Historical Energy Data about Barbados
Total Oil Supply
Total Consumption of Petroleum Products
Oil and Petroleum Products, Net Exports/Imports (-)
Production of Crude Oil including Lease Condensate
Crude Oil Proved Reserves
Dry Natural Gas Production
Dry Natural Gas Consumption
Dry Natural Gas, Net Exports/Imports (-)
Proved Reserves of Natural Gas
Coal, Net Exports/Imports (-)
Total Electricity Net Generation
Total Electricity Net Consumption
Electricity, Net Exports/Imports (-)
Total Conventional Thermal Electricity Net Generation
Total Biofuels Production
Total Primary Energy Production
Total Primary Energy Consumption
Total Carbon Dioxide Emissions from the Consumption of Energy
Population