| Business / Energy Data |
Fiji: Total Coal Consumption
Thousand Short Tons
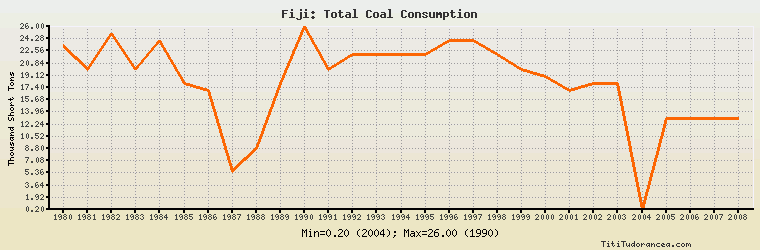
| Year | Fiji | Change, percent | Fiji, percent of Asia & Oceania | Fiji, percent of World |
| 1980 | 23.149 | N/A | 0.002% | 0.001% |
| 1981 | 20.000 | -13.603% | 0.002% | 0.000% |
| 1982 | 25.000 | 25.000% | 0.002% | 0.001% |
| 1983 | 20.000 | -20.000% | 0.002% | 0.000% |
| 1984 | 24.000 | 20.000% | 0.002% | 0.001% |
| 1985 | 18.000 | -25.000% | 0.001% | 0.000% |
| 1986 | 17.000 | -5.556% | 0.001% | 0.000% |
| 1987 | 5.500 | -67.647% | 0.000% | 0.000% |
| 1988 | 8.800 | 60.000% | 0.001% | 0.000% |
| 1989 | 18.000 | 104.545% | 0.001% | 0.000% |
| 1990 | 26.000 | 44.444% | 0.001% | 0.000% |
| 1991 | 20.000 | -23.077% | 0.001% | 0.000% |
| 1992 | 22.000 | 10.000% | 0.001% | 0.000% |
| 1993 | 22.000 | 0.000% | 0.001% | 0.000% |
| 1994 | 22.000 | 0.000% | 0.001% | 0.000% |
| 1995 | 22.000 | 0.000% | 0.001% | 0.000% |
| 1996 | 24.000 | 9.091% | 0.001% | 0.000% |
| 1997 | 24.000 | 0.000% | 0.001% | 0.000% |
| 1998 | 22.000 | -8.333% | 0.001% | 0.000% |
| 1999 | 20.000 | -9.091% | 0.001% | 0.000% |
| 2000 | 19.000 | -5.000% | 0.001% | 0.000% |
| 2001 | 17.000 | -10.526% | 0.001% | 0.000% |
| 2002 | 18.000 | 5.882% | 0.001% | 0.000% |
| 2003 | 18.000 | 0.000% | 0.001% | 0.000% |
| 2004 | 0.200 | -98.889% | 0.000% | 0.000% |
| 2005 | 13.000 | 6,400.000% | 0.000% | 0.000% |
| 2006 | 13.000 | 0.000% | 0.000% | 0.000% |
| 2007 | 13.000 | 0.000% | 0.000% | 0.000% |
| 2008 | 13.000 | 0.000% | 0.000% | 0.000% |
| 2009 | N/A | N/A | N/A | N/A |
| 2010 | N/A | N/A | N/A | N/A |
Historical Energy Data about Fiji
Total Consumption of Petroleum Products
Oil and Petroleum Products, Net Exports/Imports (-)
Dry Natural Gas, Net Exports/Imports (-)
Total Coal Consumption
Coal, Net Exports/Imports (-)
Total Electricity Net Generation
Total Electricity Net Consumption
Electricity, Net Exports/Imports (-)
Total Conventional Thermal Electricity Net Generation
Hydroelectricity Net Generation
Total Primary Energy Production
Total Primary Energy Consumption
Total Carbon Dioxide Emissions from the Consumption of Energy
Population