| Business / Energy Data |
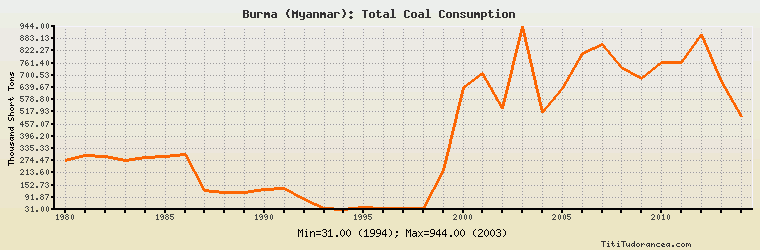
Burma (Myanmar): Total Coal Consumption
Thousand Short Tons
| Year | Burma (Myanmar) | Change, percent | Burma (Myanmar), percent of Asia & Oceania | Burma (Myanmar), percent of World |
| 1980 | 273.373 | N/A | 0.025% | 0.007% |
| 1981 | 299.000 | 9.374% | 0.027% | 0.007% |
| 1982 | 294.000 | -1.672% | 0.025% | 0.007% |
| 1983 | 277.000 | -5.782% | 0.022% | 0.006% |
| 1984 | 289.000 | 4.332% | 0.021% | 0.006% |
| 1985 | 293.000 | 1.384% | 0.021% | 0.006% |
| 1986 | 306.000 | 4.437% | 0.021% | 0.006% |
| 1987 | 126.000 | -58.824% | 0.008% | 0.003% |
| 1988 | 116.000 | -7.937% | 0.007% | 0.002% |
| 1989 | 115.000 | -0.862% | 0.007% | 0.002% |
| 1990 | 130.000 | 13.043% | 0.007% | 0.002% |
| 1991 | 138.000 | 6.154% | 0.008% | 0.003% |
| 1992 | 80.000 | -42.029% | 0.004% | 0.002% |
| 1993 | 37.000 | -53.750% | 0.002% | 0.001% |
| 1994 | 31.000 | -16.216% | 0.002% | 0.001% |
| 1995 | 42.000 | 35.484% | 0.002% | 0.001% |
| 1996 | 34.000 | -19.048% | 0.002% | 0.001% |
| 1997 | 35.000 | 2.941% | 0.002% | 0.001% |
| 1998 | 36.000 | 2.857% | 0.002% | 0.001% |
| 1999 | 224.000 | 522.222% | 0.010% | 0.004% |
| 2000 | 639.000 | 185.268% | 0.026% | 0.012% |
| 2001 | 708.000 | 10.798% | 0.028% | 0.013% |
| 2002 | 537.000 | -24.153% | 0.020% | 0.010% |
| 2003 | 944.000 | 75.791% | 0.030% | 0.016% |
| 2004 | 515.000 | -45.445% | 0.015% | 0.008% |
| 2005 | 633.000 | 22.913% | 0.016% | 0.009% |
| 2006 | 808.000 | 27.646% | 0.019% | 0.011% |
| 2007 | 854.000 | 5.693% | 0.019% | 0.011% |
| 2008 | 737.000 | -13.700% | 0.016% | 0.010% |
| 2009 | 683.000 | -7.327% | 0.014% | 0.009% |
| 2010 | 763.000 | 11.713% | 0.014% | 0.009% |
| 2011 | 763.000 | 0.000% | 0.013% | 0.009% |
| 2012 | 903.000 | 18.349% | 0.015% | 0.010% |
| 2013 | 671.000 | -25.692% | 0.011% | 0.007% |
| 2014 | 494.000 | -26.379% | 0.008% | 0.006% |
Historical Energy Data about Burma (Myanmar)
Total Oil Supply
Total Consumption of Petroleum Products
Oil and Petroleum Products, Net Exports/Imports (-)
Production of Crude Oil including Lease Condensate
Crude Oil Proved Reserves
Dry Natural Gas Production
Dry Natural Gas Consumption
Dry Natural Gas, Net Exports/Imports (-)
Proved Reserves of Natural Gas
Total Primary Coal Production
Total Coal Consumption
Coal, Net Exports/Imports (-)
Total Recoverable Coal
Total Electricity Net Generation
Total Electricity Net Consumption
Electricity, Net Exports/Imports (-)
Total Conventional Thermal Electricity Net Generation
Hydroelectricity Net Generation
Total Primary Energy Production
Total Primary Energy Consumption
Total Carbon Dioxide Emissions from the Consumption of Energy
Population