| Business / Energy Data |
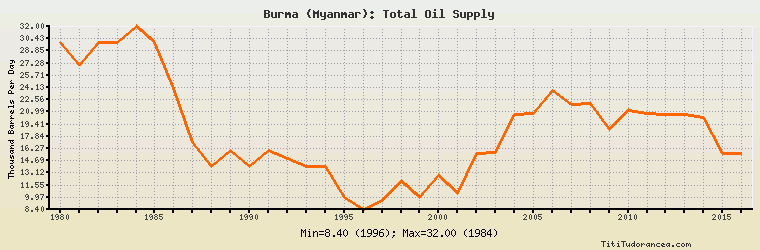
Burma (Myanmar): Total Oil Supply
Thousand Barrels Per Day
| Year | Burma (Myanmar) | Change, percent | Burma (Myanmar), percent of Asia & Oceania | Burma (Myanmar), percent of World |
| 1980 | 30.000 | N/A | 0.589% | 0.047% |
| 1981 | 27.000 | -10.000% | 0.531% | 0.045% |
| 1982 | 30.000 | 11.111% | 0.608% | 0.052% |
| 1983 | 30.000 | 0.000% | 0.572% | 0.052% |
| 1984 | 32.000 | 6.667% | 0.564% | 0.054% |
| 1985 | 30.000 | -6.250% | 0.500% | 0.051% |
| 1986 | 24.000 | -20.000% | 0.389% | 0.039% |
| 1987 | 17.000 | -29.167% | 0.275% | 0.027% |
| 1988 | 14.000 | -17.647% | 0.222% | 0.022% |
| 1989 | 16.000 | 14.286% | 0.245% | 0.024% |
| 1990 | 14.000 | -12.500% | 0.208% | 0.021% |
| 1991 | 16.000 | 14.286% | 0.231% | 0.024% |
| 1992 | 15.000 | -6.250% | 0.217% | 0.023% |
| 1993 | 14.000 | -6.667% | 0.200% | 0.021% |
| 1994 | 14.000 | 0.000% | 0.195% | 0.020% |
| 1995 | 10.000 | -28.571% | 0.133% | 0.014% |
| 1996 | 8.400 | -16.000% | 0.109% | 0.012% |
| 1997 | 9.600 | 14.286% | 0.121% | 0.013% |
| 1998 | 12.000 | 25.000% | 0.149% | 0.016% |
| 1999 | 10.000 | -16.667% | 0.124% | 0.013% |
| 2000 | 12.740 | 27.400% | 0.153% | 0.016% |
| 2001 | 10.488 | -17.677% | 0.126% | 0.014% |
| 2002 | 15.602 | 48.760% | 0.187% | 0.020% |
| 2003 | 15.687 | 0.545% | 0.190% | 0.020% |
| 2004 | 20.684 | 31.854% | 0.247% | 0.025% |
| 2005 | 20.751 | 0.324% | 0.243% | 0.024% |
| 2006 | 23.791 | 14.650% | 0.276% | 0.028% |
| 2007 | 21.955 | -7.717% | 0.254% | 0.026% |
| 2008 | 22.060 | 0.478% | 0.250% | 0.025% |
| 2009 | 18.776 | -14.887% | 0.211% | 0.022% |
| 2010 | 21.156 | 12.676% | 0.226% | 0.024% |
| 2011 | 20.734 | -1.995% | 0.222% | 0.023% |
| 2012 | 20.635 | -0.477% | 0.218% | 0.023% |
| 2013 | 20.635 | 0.000% | 0.217% | 0.023% |
| 2014 | 20.210 | -2.060% | 0.210% | 0.022% |
| 2015 | 15.635 | -22.637% | 0.160% | 0.016% |
| 2016 | 15.635 | 0.000% | 0.164% | 0.016% |
Historical Energy Data about Burma (Myanmar)
Total Oil Supply
Total Consumption of Petroleum Products
Oil and Petroleum Products, Net Exports/Imports (-)
Production of Crude Oil including Lease Condensate
Crude Oil Proved Reserves
Dry Natural Gas Production
Dry Natural Gas Consumption
Dry Natural Gas, Net Exports/Imports (-)
Proved Reserves of Natural Gas
Total Primary Coal Production
Total Coal Consumption
Coal, Net Exports/Imports (-)
Total Recoverable Coal
Total Electricity Net Generation
Total Electricity Net Consumption
Electricity, Net Exports/Imports (-)
Total Conventional Thermal Electricity Net Generation
Hydroelectricity Net Generation
Total Primary Energy Production
Total Primary Energy Consumption
Total Carbon Dioxide Emissions from the Consumption of Energy
Population