| Business / Energy Data |
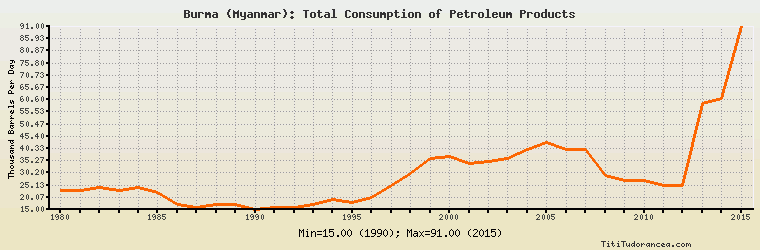
Burma (Myanmar): Total Consumption of Petroleum Products
Thousand Barrels Per Day
| Year | Burma (Myanmar) | Change, percent | Burma (Myanmar), percent of Asia & Oceania | Burma (Myanmar), percent of World |
| 1980 | 23.000 | N/A | 0.215% | 0.037% |
| 1981 | 23.000 | 0.000% | 0.216% | 0.038% |
| 1982 | 24.000 | 4.348% | 0.230% | 0.040% |
| 1983 | 23.000 | -4.167% | 0.222% | 0.039% |
| 1984 | 24.000 | 4.348% | 0.223% | 0.040% |
| 1985 | 22.000 | -8.333% | 0.205% | 0.037% |
| 1986 | 17.000 | -22.727% | 0.153% | 0.027% |
| 1987 | 16.000 | -5.882% | 0.139% | 0.025% |
| 1988 | 17.000 | 6.250% | 0.138% | 0.026% |
| 1989 | 17.000 | 0.000% | 0.129% | 0.026% |
| 1990 | 15.000 | -11.765% | 0.109% | 0.023% |
| 1991 | 16.000 | 6.667% | 0.111% | 0.024% |
| 1992 | 16.000 | 0.000% | 0.105% | 0.024% |
| 1993 | 17.000 | 6.250% | 0.106% | 0.025% |
| 1994 | 19.000 | 11.765% | 0.112% | 0.028% |
| 1995 | 18.000 | -5.263% | 0.101% | 0.026% |
| 1996 | 20.000 | 11.111% | 0.107% | 0.028% |
| 1997 | 25.000 | 25.000% | 0.128% | 0.034% |
| 1998 | 30.000 | 20.000% | 0.156% | 0.040% |
| 1999 | 36.000 | 20.000% | 0.178% | 0.047% |
| 2000 | 37.000 | 2.778% | 0.178% | 0.048% |
| 2001 | 34.000 | -8.108% | 0.162% | 0.044% |
| 2002 | 35.000 | 2.941% | 0.163% | 0.045% |
| 2003 | 36.000 | 2.857% | 0.160% | 0.045% |
| 2004 | 40.000 | 11.111% | 0.168% | 0.048% |
| 2005 | 43.000 | 7.500% | 0.177% | 0.051% |
| 2006 | 40.000 | -6.977% | 0.161% | 0.047% |
| 2007 | 40.000 | 0.000% | 0.157% | 0.046% |
| 2008 | 29.000 | -27.500% | 0.114% | 0.034% |
| 2009 | 27.000 | -6.897% | 0.103% | 0.032% |
| 2010 | 27.000 | 0.000% | 0.096% | 0.030% |
| 2011 | 25.000 | -7.407% | 0.087% | 0.028% |
| 2012 | 25.000 | 0.000% | 0.083% | 0.027% |
| 2013 | 59.000 | 136.000% | 0.192% | 0.064% |
| 2014 | 61.000 | 3.390% | 0.196% | 0.065% |
| 2015 | 91.000 | 49.180% | 0.281% | 0.095% |
Historical Energy Data about Burma (Myanmar)
Total Oil Supply
Total Consumption of Petroleum Products
Oil and Petroleum Products, Net Exports/Imports (-)
Production of Crude Oil including Lease Condensate
Crude Oil Proved Reserves
Dry Natural Gas Production
Dry Natural Gas Consumption
Dry Natural Gas, Net Exports/Imports (-)
Proved Reserves of Natural Gas
Total Primary Coal Production
Total Coal Consumption
Coal, Net Exports/Imports (-)
Total Recoverable Coal
Total Electricity Net Generation
Total Electricity Net Consumption
Electricity, Net Exports/Imports (-)
Total Conventional Thermal Electricity Net Generation
Hydroelectricity Net Generation
Total Primary Energy Production
Total Primary Energy Consumption
Total Carbon Dioxide Emissions from the Consumption of Energy
Population