| Business / Energy Data |
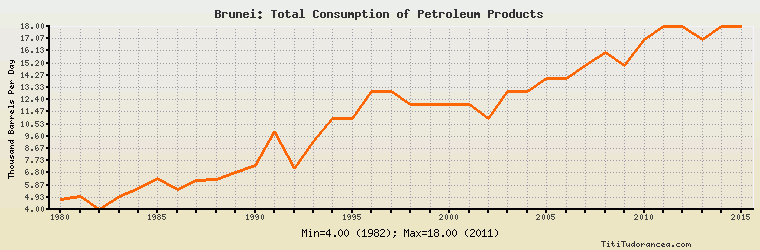
Brunei: Total Consumption of Petroleum Products
Thousand Barrels Per Day
| Year | Brunei | Change, percent | Brunei, percent of Asia & Oceania | Brunei, percent of World |
| 1980 | 4.800 | N/A | 0.045% | 0.008% |
| 1981 | 5.000 | 4.167% | 0.047% | 0.008% |
| 1982 | 4.000 | -20.000% | 0.038% | 0.007% |
| 1983 | 5.000 | 25.000% | 0.048% | 0.009% |
| 1984 | 5.600 | 12.000% | 0.052% | 0.009% |
| 1985 | 6.400 | 14.286% | 0.060% | 0.011% |
| 1986 | 5.500 | -14.063% | 0.050% | 0.009% |
| 1987 | 6.200 | 12.727% | 0.054% | 0.010% |
| 1988 | 6.300 | 1.613% | 0.051% | 0.010% |
| 1989 | 6.800 | 7.937% | 0.052% | 0.010% |
| 1990 | 7.400 | 8.824% | 0.054% | 0.011% |
| 1991 | 10.000 | 35.135% | 0.069% | 0.015% |
| 1992 | 7.100 | -29.000% | 0.047% | 0.011% |
| 1993 | 9.200 | 29.577% | 0.058% | 0.014% |
| 1994 | 11.000 | 19.565% | 0.065% | 0.016% |
| 1995 | 11.000 | 0.000% | 0.061% | 0.016% |
| 1996 | 13.000 | 18.182% | 0.069% | 0.018% |
| 1997 | 13.000 | 0.000% | 0.067% | 0.018% |
| 1998 | 12.000 | -7.692% | 0.062% | 0.016% |
| 1999 | 12.000 | 0.000% | 0.059% | 0.016% |
| 2000 | 12.000 | 0.000% | 0.058% | 0.016% |
| 2001 | 12.000 | 0.000% | 0.057% | 0.015% |
| 2002 | 11.000 | -8.333% | 0.051% | 0.014% |
| 2003 | 13.000 | 18.182% | 0.058% | 0.016% |
| 2004 | 13.000 | 0.000% | 0.054% | 0.016% |
| 2005 | 14.000 | 7.692% | 0.058% | 0.017% |
| 2006 | 14.000 | 0.000% | 0.056% | 0.016% |
| 2007 | 15.000 | 7.143% | 0.059% | 0.017% |
| 2008 | 16.000 | 6.667% | 0.063% | 0.019% |
| 2009 | 15.000 | -6.250% | 0.057% | 0.018% |
| 2010 | 17.000 | 13.333% | 0.061% | 0.019% |
| 2011 | 18.000 | 5.882% | 0.062% | 0.020% |
| 2012 | 18.000 | 0.000% | 0.060% | 0.020% |
| 2013 | 17.000 | -5.556% | 0.055% | 0.018% |
| 2014 | 18.000 | 5.882% | 0.058% | 0.019% |
| 2015 | 18.000 | 0.000% | 0.056% | 0.019% |
Historical Energy Data about Brunei
Total Oil Supply
Total Consumption of Petroleum Products
Oil and Petroleum Products, Net Exports/Imports (-)
Production of Crude Oil including Lease Condensate
Crude Oil Proved Reserves
Dry Natural Gas Production
Dry Natural Gas Consumption
Dry Natural Gas, Net Exports/Imports (-)
Proved Reserves of Natural Gas
Total Coal Consumption
Coal, Net Exports/Imports (-)
Total Electricity Net Generation
Total Electricity Net Consumption
Electricity, Net Exports/Imports (-)
Total Conventional Thermal Electricity Net Generation
Total Primary Energy Production
Total Primary Energy Consumption
Total Carbon Dioxide Emissions from the Consumption of Energy
Population