| Business / Energy Data |
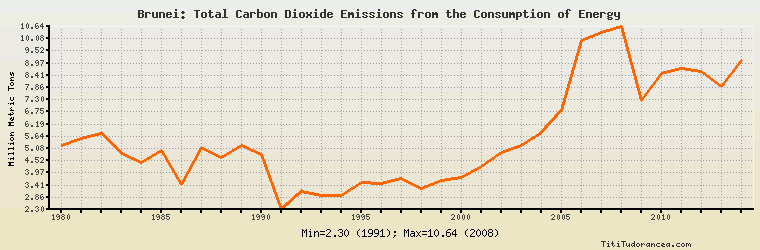
Brunei: Total Carbon Dioxide Emissions from the Consumption of Energy
Million Metric Tons
| Year | Brunei | Change, percent | Brunei, percent of Asia & Oceania | Brunei, percent of World |
| 1980 | 5.233 | N/A | 0.150% | 0.028% |
| 1981 | 5.555 | 6.153% | 0.157% | 0.031% |
| 1982 | 5.776 | 3.978% | 0.161% | 0.032% |
| 1983 | 4.863 | -15.807% | 0.132% | 0.027% |
| 1984 | 4.433 | -8.842% | 0.112% | 0.023% |
| 1985 | 5.007 | 12.948% | 0.122% | 0.026% |
| 1986 | 3.424 | -31.616% | 0.082% | 0.017% |
| 1987 | 5.117 | 49.445% | 0.116% | 0.025% |
| 1988 | 4.687 | -8.403% | 0.099% | 0.022% |
| 1989 | 5.217 | 11.308% | 0.108% | 0.024% |
| 1990 | 4.793 | -8.127% | 0.091% | 0.022% |
| 1991 | 2.302 | -51.972% | 0.044% | 0.011% |
| 1992 | 3.122 | 35.621% | 0.058% | 0.015% |
| 1993 | 2.951 | -5.477% | 0.052% | 0.014% |
| 1994 | 2.939 | -0.407% | 0.049% | 0.014% |
| 1995 | 3.522 | 19.837% | 0.055% | 0.016% |
| 1996 | 3.498 | -0.681% | 0.053% | 0.016% |
| 1997 | 3.710 | 6.061% | 0.056% | 0.017% |
| 1998 | 3.245 | -12.534% | 0.049% | 0.014% |
| 1999 | 3.616 | 11.433% | 0.052% | 0.016% |
| 2000 | 3.775 | 4.397% | 0.052% | 0.016% |
| 2001 | 4.253 | 12.662% | 0.057% | 0.018% |
| 2002 | 4.890 | 14.978% | 0.062% | 0.020% |
| 2003 | 5.196 | 6.258% | 0.060% | 0.020% |
| 2004 | 5.826 | 12.125% | 0.062% | 0.022% |
| 2005 | 6.828 | 17.199% | 0.067% | 0.025% |
| 2006 | 10.012 | 46.632% | 0.092% | 0.035% |
| 2007 | 10.377 | 3.646% | 0.090% | 0.035% |
| 2008 | 10.636 | 2.496% | 0.090% | 0.036% |
| 2009 | 7.287 | -31.487% | 0.058% | 0.025% |
| 2010 | 8.495 | 16.577% | 0.063% | 0.027% |
| 2011 | 8.702 | 2.437% | 0.060% | 0.027% |
| 2012 | 8.600 | -1.172% | 0.056% | 0.026% |
| 2013 | 7.923 | -7.872% | 0.050% | 0.024% |
| 2014 | 9.087 | 14.691% | 0.057% | 0.027% |
Historical Energy Data about Brunei
Total Oil Supply
Total Consumption of Petroleum Products
Oil and Petroleum Products, Net Exports/Imports (-)
Production of Crude Oil including Lease Condensate
Crude Oil Proved Reserves
Dry Natural Gas Production
Dry Natural Gas Consumption
Dry Natural Gas, Net Exports/Imports (-)
Proved Reserves of Natural Gas
Total Coal Consumption
Coal, Net Exports/Imports (-)
Total Electricity Net Generation
Total Electricity Net Consumption
Electricity, Net Exports/Imports (-)
Total Conventional Thermal Electricity Net Generation
Total Primary Energy Production
Total Primary Energy Consumption
Total Carbon Dioxide Emissions from the Consumption of Energy
Population