| Business / Energy Data |
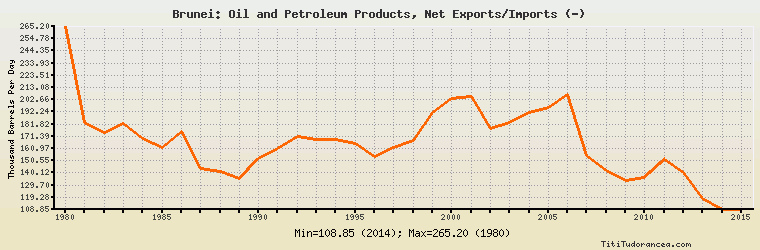
Brunei: Oil and Petroleum Products, Net Exports/Imports (-)
Thousand Barrels Per Day
| Year | Brunei | Change, percent | Brunei, percent of Asia & Oceania | Brunei, percent of World |
| 1980 | 265.200 | N/A | -4.727% | N/A |
| 1981 | 183.000 | -30.995% | -3.281% | N/A |
| 1982 | 175.000 | -4.372% | -3.193% | N/A |
| 1983 | 182.000 | 4.000% | -3.562% | N/A |
| 1984 | 169.400 | -6.923% | -3.318% | N/A |
| 1985 | 161.600 | -4.604% | -3.417% | N/A |
| 1986 | 175.500 | 8.601% | -3.568% | N/A |
| 1987 | 143.800 | -18.063% | -2.710% | N/A |
| 1988 | 141.700 | -1.460% | -2.345% | N/A |
| 1989 | 135.200 | -4.587% | -2.044% | N/A |
| 1990 | 152.600 | 12.870% | -2.161% | N/A |
| 1991 | 161.000 | 5.505% | -2.152% | N/A |
| 1992 | 170.900 | 6.149% | -2.065% | N/A |
| 1993 | 168.800 | -1.229% | -1.880% | N/A |
| 1994 | 169.000 | 0.118% | -1.718% | N/A |
| 1995 | 165.000 | -2.367% | -1.587% | N/A |
| 1996 | 154.000 | -6.667% | -1.399% | N/A |
| 1997 | 162.000 | 5.195% | -1.400% | N/A |
| 1998 | 168.000 | 3.704% | -1.498% | N/A |
| 1999 | 192.000 | 14.286% | -1.577% | N/A |
| 2000 | 203.368 | 5.921% | -1.626% | N/A |
| 2001 | 205.584 | 1.090% | -1.621% | N/A |
| 2002 | 178.407 | -13.219% | -1.353% | N/A |
| 2003 | 183.368 | 2.781% | -1.290% | N/A |
| 2004 | 191.431 | 4.397% | -1.236% | N/A |
| 2005 | 195.959 | 2.365% | -1.241% | N/A |
| 2006 | 207.244 | 5.759% | -1.272% | N/A |
| 2007 | 154.967 | -25.225% | -0.918% | N/A |
| 2008 | 141.764 | -8.520% | -0.858% | N/A |
| 2009 | 133.858 | -5.577% | -0.775% | N/A |
| 2010 | 136.328 | 1.845% | -0.731% | N/A |
| 2011 | 151.427 | 11.075% | -0.775% | N/A |
| 2012 | 140.735 | -7.061% | -0.685% | N/A |
| 2013 | 118.471 | -15.820% | -0.557% | N/A |
| 2014 | 108.854 | -8.118% | -0.505% | N/A |
| 2015 | 108.997 | 0.131% | -0.483% | N/A |
Historical Energy Data about Brunei
Total Oil Supply
Total Consumption of Petroleum Products
Oil and Petroleum Products, Net Exports/Imports (-)
Production of Crude Oil including Lease Condensate
Crude Oil Proved Reserves
Dry Natural Gas Production
Dry Natural Gas Consumption
Dry Natural Gas, Net Exports/Imports (-)
Proved Reserves of Natural Gas
Total Coal Consumption
Coal, Net Exports/Imports (-)
Total Electricity Net Generation
Total Electricity Net Consumption
Electricity, Net Exports/Imports (-)
Total Conventional Thermal Electricity Net Generation
Total Primary Energy Production
Total Primary Energy Consumption
Total Carbon Dioxide Emissions from the Consumption of Energy
Population