| Business / Energy Data |
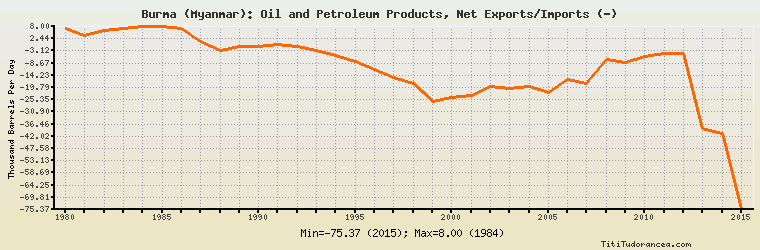
Burma (Myanmar): Oil and Petroleum Products, Net Exports/Imports (-)
Thousand Barrels Per Day
| Year | Burma (Myanmar) | Change, percent | Burma (Myanmar), percent of Asia & Oceania | Burma (Myanmar), percent of World |
| 1980 | 7.000 | N/A | -0.125% | N/A |
| 1981 | 4.000 | -42.857% | -0.072% | N/A |
| 1982 | 6.000 | 50.000% | -0.109% | N/A |
| 1983 | 7.000 | 16.667% | -0.137% | N/A |
| 1984 | 8.000 | 14.286% | -0.157% | N/A |
| 1985 | 8.000 | 0.000% | -0.169% | N/A |
| 1986 | 7.000 | -12.500% | -0.142% | N/A |
| 1987 | 1.000 | -85.714% | -0.019% | N/A |
| 1988 | -3.000 | -400.000% | 0.050% | N/A |
| 1989 | -1.000 | -66.667% | 0.015% | N/A |
| 1990 | -1.000 | 0.000% | 0.014% | N/A |
| 1991 | 0.000 | -100.000% | 0.00% | N/A |
| 1992 | -1.000 | 0.000% | 0.012% | N/A |
| 1993 | -3.000 | 200.000% | 0.033% | N/A |
| 1994 | -5.000 | 66.667% | 0.051% | N/A |
| 1995 | -8.000 | 60.000% | 0.077% | N/A |
| 1996 | -11.600 | 45.000% | 0.105% | N/A |
| 1997 | -15.400 | 32.759% | 0.133% | N/A |
| 1998 | -18.000 | 16.883% | 0.161% | N/A |
| 1999 | -26.000 | 44.444% | 0.213% | N/A |
| 2000 | -24.260 | -6.692% | 0.194% | N/A |
| 2001 | -23.512 | -3.083% | 0.185% | N/A |
| 2002 | -19.398 | -17.497% | 0.147% | N/A |
| 2003 | -20.313 | 4.717% | 0.143% | N/A |
| 2004 | -19.316 | -4.908% | 0.125% | N/A |
| 2005 | -22.249 | 15.184% | 0.141% | N/A |
| 2006 | -16.209 | -27.147% | 0.099% | N/A |
| 2007 | -18.045 | 11.327% | 0.107% | N/A |
| 2008 | -6.940 | -61.541% | 0.042% | N/A |
| 2009 | -8.224 | 18.501% | 0.048% | N/A |
| 2010 | -5.844 | -28.940% | 0.031% | N/A |
| 2011 | -4.266 | -27.002% | 0.022% | N/A |
| 2012 | -4.365 | 2.321% | 0.021% | N/A |
| 2013 | -38.365 | 778.923% | 0.180% | N/A |
| 2014 | -40.790 | 6.321% | 0.189% | N/A |
| 2015 | -75.365 | 84.763% | 0.334% | N/A |
Historical Energy Data about Burma (Myanmar)
Total Oil Supply
Total Consumption of Petroleum Products
Oil and Petroleum Products, Net Exports/Imports (-)
Production of Crude Oil including Lease Condensate
Crude Oil Proved Reserves
Dry Natural Gas Production
Dry Natural Gas Consumption
Dry Natural Gas, Net Exports/Imports (-)
Proved Reserves of Natural Gas
Total Primary Coal Production
Total Coal Consumption
Coal, Net Exports/Imports (-)
Total Recoverable Coal
Total Electricity Net Generation
Total Electricity Net Consumption
Electricity, Net Exports/Imports (-)
Total Conventional Thermal Electricity Net Generation
Hydroelectricity Net Generation
Total Primary Energy Production
Total Primary Energy Consumption
Total Carbon Dioxide Emissions from the Consumption of Energy
Population