| Business / Energy Data |
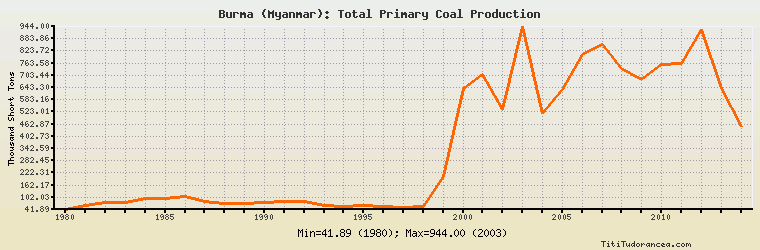
Burma (Myanmar): Total Primary Coal Production
Thousand Short Tons
| Year | Burma (Myanmar) | Change, percent | Burma (Myanmar), percent of Asia & Oceania | Burma (Myanmar), percent of World |
| 1980 | 41.888 | N/A | 0.004% | 0.001% |
| 1981 | 62.000 | 48.014% | 0.006% | 0.001% |
| 1982 | 74.000 | 19.355% | 0.007% | 0.002% |
| 1983 | 78.000 | 5.405% | 0.007% | 0.002% |
| 1984 | 96.000 | 23.077% | 0.007% | 0.002% |
| 1985 | 95.000 | -1.042% | 0.007% | 0.002% |
| 1986 | 108.000 | 13.684% | 0.007% | 0.002% |
| 1987 | 82.000 | -24.074% | 0.005% | 0.002% |
| 1988 | 72.000 | -12.195% | 0.004% | 0.001% |
| 1989 | 72.000 | 0.000% | 0.004% | 0.001% |
| 1990 | 76.000 | 5.556% | 0.004% | 0.001% |
| 1991 | 83.000 | 9.211% | 0.005% | 0.002% |
| 1992 | 80.000 | -3.614% | 0.004% | 0.002% |
| 1993 | 64.000 | -20.000% | 0.003% | 0.001% |
| 1994 | 58.000 | -9.375% | 0.003% | 0.001% |
| 1995 | 64.000 | 10.345% | 0.003% | 0.001% |
| 1996 | 58.000 | -9.375% | 0.003% | 0.001% |
| 1997 | 54.000 | -6.897% | 0.002% | 0.001% |
| 1998 | 57.000 | 5.556% | 0.003% | 0.001% |
| 1999 | 207.000 | 263.158% | 0.009% | 0.004% |
| 2000 | 639.000 | 208.696% | 0.027% | 0.013% |
| 2001 | 708.000 | 10.798% | 0.028% | 0.014% |
| 2002 | 537.000 | -24.153% | 0.020% | 0.010% |
| 2003 | 944.000 | 75.791% | 0.031% | 0.017% |
| 2004 | 515.000 | -45.445% | 0.015% | 0.008% |
| 2005 | 633.000 | 22.913% | 0.017% | 0.010% |
| 2006 | 808.000 | 27.646% | 0.020% | 0.012% |
| 2007 | 854.000 | 5.693% | 0.019% | 0.012% |
| 2008 | 737.000 | -13.700% | 0.016% | 0.010% |
| 2009 | 683.000 | -7.327% | 0.014% | N/A |
| 2010 | 756.000 | 10.688% | 0.014% | N/A |
| 2011 | 764.000 | 1.058% | 0.013% | N/A |
| 2012 | 930.000 | 21.728% | 0.015% | N/A |
| 2013 | 636.000 | -31.613% | 0.010% | N/A |
| 2014 | 449.000 | -29.403% | 0.007% | N/A |
Historical Energy Data about Burma (Myanmar)
Total Oil Supply
Total Consumption of Petroleum Products
Oil and Petroleum Products, Net Exports/Imports (-)
Production of Crude Oil including Lease Condensate
Crude Oil Proved Reserves
Dry Natural Gas Production
Dry Natural Gas Consumption
Dry Natural Gas, Net Exports/Imports (-)
Proved Reserves of Natural Gas
Total Primary Coal Production
Total Coal Consumption
Coal, Net Exports/Imports (-)
Total Recoverable Coal
Total Electricity Net Generation
Total Electricity Net Consumption
Electricity, Net Exports/Imports (-)
Total Conventional Thermal Electricity Net Generation
Hydroelectricity Net Generation
Total Primary Energy Production
Total Primary Energy Consumption
Total Carbon Dioxide Emissions from the Consumption of Energy
Population