| Business / Energy Data |
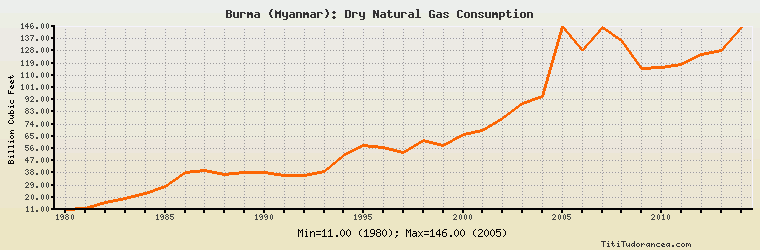
Burma (Myanmar): Dry Natural Gas Consumption
Billion Cubic Feet
| Year | Burma (Myanmar) | Change, percent | Burma (Myanmar), percent of Asia & Oceania | Burma (Myanmar), percent of World |
| 1980 | 11.000 | N/A | 0.427% | 0.021% |
| 1981 | 12.000 | 9.091% | 0.443% | 0.022% |
| 1982 | 16.000 | 33.333% | 0.573% | 0.030% |
| 1983 | 19.000 | 18.750% | 0.625% | 0.035% |
| 1984 | 23.000 | 21.053% | 0.633% | 0.039% |
| 1985 | 28.000 | 21.739% | 0.692% | 0.045% |
| 1986 | 38.000 | 35.714% | 0.881% | 0.060% |
| 1987 | 40.000 | 5.263% | 0.866% | 0.060% |
| 1988 | 37.000 | -7.500% | 0.737% | 0.053% |
| 1989 | 38.000 | 2.703% | 0.718% | 0.052% |
| 1990 | 38.000 | 0.000% | 0.653% | 0.052% |
| 1991 | 36.000 | -5.263% | 0.570% | 0.048% |
| 1992 | 36.000 | 0.000% | 0.547% | 0.048% |
| 1993 | 39.000 | 8.333% | 0.558% | 0.051% |
| 1994 | 51.000 | 30.769% | 0.674% | 0.066% |
| 1995 | 58.000 | 13.725% | 0.726% | 0.073% |
| 1996 | 57.000 | -1.724% | 0.655% | 0.070% |
| 1997 | 53.000 | -7.018% | 0.581% | 0.065% |
| 1998 | 62.000 | 16.981% | 0.671% | 0.076% |
| 1999 | 58.000 | -6.452% | 0.583% | 0.069% |
| 2000 | 66.000 | 13.793% | 0.629% | 0.076% |
| 2001 | 69.000 | 4.545% | 0.645% | 0.079% |
| 2002 | 78.000 | 13.043% | 0.671% | 0.085% |
| 2003 | 89.000 | 14.103% | 0.730% | 0.095% |
| 2004 | 94.000 | 5.618% | 0.734% | 0.097% |
| 2005 | 146.000 | 55.319% | 1.063% | 0.147% |
| 2006 | 128.000 | -12.329% | 0.843% | 0.125% |
| 2007 | 145.000 | 13.281% | 0.856% | 0.137% |
| 2008 | 136.000 | -6.207% | 0.773% | 0.125% |
| 2009 | 115.000 | -15.441% | 0.621% | 0.109% |
| 2010 | 116.000 | 0.870% | 0.560% | 0.102% |
| 2011 | 118.000 | 1.724% | 0.532% | 0.101% |
| 2012 | 125.000 | 5.932% | 0.539% | 0.103% |
| 2013 | 128.000 | 2.400% | 0.535% | 0.104% |
| 2014 | 145.000 | 13.281% | 0.586% | 0.118% |
Historical Energy Data about Burma (Myanmar)
Total Oil Supply
Total Consumption of Petroleum Products
Oil and Petroleum Products, Net Exports/Imports (-)
Production of Crude Oil including Lease Condensate
Crude Oil Proved Reserves
Dry Natural Gas Production
Dry Natural Gas Consumption
Dry Natural Gas, Net Exports/Imports (-)
Proved Reserves of Natural Gas
Total Primary Coal Production
Total Coal Consumption
Coal, Net Exports/Imports (-)
Total Recoverable Coal
Total Electricity Net Generation
Total Electricity Net Consumption
Electricity, Net Exports/Imports (-)
Total Conventional Thermal Electricity Net Generation
Hydroelectricity Net Generation
Total Primary Energy Production
Total Primary Energy Consumption
Total Carbon Dioxide Emissions from the Consumption of Energy
Population