| Business / Energy Data |
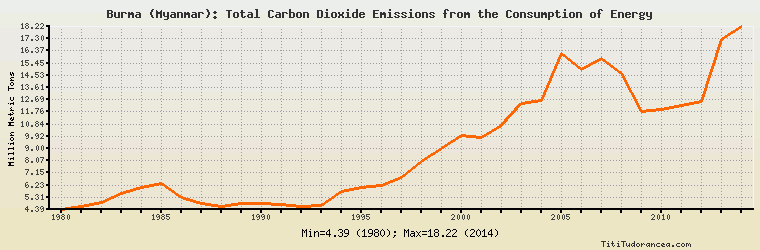
Burma (Myanmar): Total Carbon Dioxide Emissions from the Consumption of Energy
Million Metric Tons
| Year | Burma (Myanmar) | Change, percent | Burma (Myanmar), percent of Asia & Oceania | Burma (Myanmar), percent of World |
| 1980 | 4.386 | N/A | 0.126% | 0.024% |
| 1981 | 4.590 | 4.651% | 0.130% | 0.025% |
| 1982 | 4.902 | 6.797% | 0.137% | 0.027% |
| 1983 | 5.561 | 13.443% | 0.151% | 0.031% |
| 1984 | 6.073 | 9.207% | 0.153% | 0.032% |
| 1985 | 6.339 | 4.380% | 0.155% | 0.033% |
| 1986 | 5.322 | -16.044% | 0.127% | 0.027% |
| 1987 | 4.828 | -9.282% | 0.110% | 0.024% |
| 1988 | 4.616 | -4.391% | 0.098% | 0.022% |
| 1989 | 4.822 | 4.463% | 0.100% | 0.023% |
| 1990 | 4.832 | 0.207% | 0.092% | 0.022% |
| 1991 | 4.773 | -1.221% | 0.092% | 0.022% |
| 1992 | 4.618 | -3.247% | 0.086% | 0.022% |
| 1993 | 4.675 | 1.234% | 0.082% | 0.022% |
| 1994 | 5.712 | 22.182% | 0.095% | 0.027% |
| 1995 | 6.036 | 5.672% | 0.095% | 0.028% |
| 1996 | 6.183 | 2.435% | 0.093% | 0.028% |
| 1997 | 6.771 | 9.510% | 0.101% | 0.030% |
| 1998 | 8.002 | 18.180% | 0.121% | 0.036% |
| 1999 | 9.034 | 12.897% | 0.130% | 0.039% |
| 2000 | 9.994 | 10.627% | 0.137% | 0.042% |
| 2001 | 9.854 | -1.401% | 0.132% | 0.041% |
| 2002 | 10.715 | 8.738% | 0.136% | 0.044% |
| 2003 | 12.417 | 15.884% | 0.144% | 0.049% |
| 2004 | 12.636 | 1.764% | 0.134% | 0.047% |
| 2005 | 16.154 | 27.841% | 0.158% | 0.058% |
| 2006 | 14.936 | -7.540% | 0.137% | 0.052% |
| 2007 | 15.782 | 5.664% | 0.137% | 0.054% |
| 2008 | 14.651 | -7.166% | 0.124% | 0.049% |
| 2009 | 11.784 | -19.569% | 0.094% | 0.040% |
| 2010 | 11.937 | 1.298% | 0.089% | 0.038% |
| 2011 | 12.253 | 2.647% | 0.084% | 0.038% |
| 2012 | 12.550 | 2.424% | 0.082% | 0.038% |
| 2013 | 17.263 | 37.554% | 0.109% | 0.051% |
| 2014 | 18.218 | 5.532% | 0.115% | 0.054% |
Historical Energy Data about Burma (Myanmar)
Total Oil Supply
Total Consumption of Petroleum Products
Oil and Petroleum Products, Net Exports/Imports (-)
Production of Crude Oil including Lease Condensate
Crude Oil Proved Reserves
Dry Natural Gas Production
Dry Natural Gas Consumption
Dry Natural Gas, Net Exports/Imports (-)
Proved Reserves of Natural Gas
Total Primary Coal Production
Total Coal Consumption
Coal, Net Exports/Imports (-)
Total Recoverable Coal
Total Electricity Net Generation
Total Electricity Net Consumption
Electricity, Net Exports/Imports (-)
Total Conventional Thermal Electricity Net Generation
Hydroelectricity Net Generation
Total Primary Energy Production
Total Primary Energy Consumption
Total Carbon Dioxide Emissions from the Consumption of Energy
Population