| Business / Demographics |
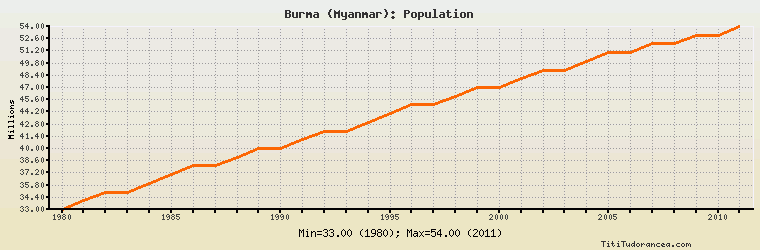
Burma (Myanmar): Population
Millions
| Year | Burma (Myanmar) | Change, percent | Burma (Myanmar), percent of Asia & Oceania | Burma (Myanmar), percent of World |
| 1980 | 33.000 | N/A | 1.336% | 0.742% |
| 1981 | 34.000 | 3.030% | 1.350% | 0.751% |
| 1982 | 35.000 | 2.941% | 1.365% | 0.759% |
| 1983 | 35.000 | 0.000% | 1.341% | 0.746% |
| 1984 | 36.000 | 2.857% | 1.355% | 0.755% |
| 1985 | 37.000 | 2.778% | 1.368% | 0.762% |
| 1986 | 38.000 | 2.703% | 1.382% | 0.770% |
| 1987 | 38.000 | 0.000% | 1.356% | 0.757% |
| 1988 | 39.000 | 2.632% | 1.367% | 0.763% |
| 1989 | 40.000 | 2.564% | 1.378% | 0.770% |
| 1990 | 40.000 | 0.000% | 1.355% | 0.757% |
| 1991 | 41.000 | 2.500% | 1.366% | 0.764% |
| 1992 | 42.000 | 2.439% | 1.377% | 0.770% |
| 1993 | 42.000 | 0.000% | 1.356% | 0.759% |
| 1994 | 43.000 | 2.381% | 1.367% | 0.766% |
| 1995 | 44.000 | 2.326% | 1.380% | 0.772% |
| 1996 | 45.000 | 2.273% | 1.390% | 0.779% |
| 1997 | 45.000 | 0.000% | 1.372% | 0.769% |
| 1998 | 46.000 | 2.222% | 1.383% | 0.775% |
| 1999 | 47.000 | 2.174% | 1.396% | 0.782% |
| 2000 | 47.000 | 0.000% | 1.379% | 0.772% |
| 2001 | 48.000 | 2.128% | 1.391% | 0.779% |
| 2002 | 49.000 | 2.083% | 1.403% | 0.785% |
| 2003 | 49.000 | 0.000% | 1.387% | 0.775% |
| 2004 | 50.000 | 2.041% | 1.400% | 0.782% |
| 2005 | 51.000 | 2.000% | 1.413% | 0.789% |
| 2006 | 51.000 | 0.000% | 1.398% | 0.779% |
| 2007 | 52.000 | 1.961% | 1.410% | 0.784% |
| 2008 | 52.000 | 0.000% | 1.396% | 0.776% |
| 2009 | 53.000 | 1.923% | 1.408% | 0.781% |
| 2010 | 53.000 | 0.000% | 1.395% | 0.772% |
| 2011 | 54.000 | 1.887% | 1.406% | 0.777% |
Historical Energy Data about Burma (Myanmar)
Total Oil Supply
Total Consumption of Petroleum Products
Oil and Petroleum Products, Net Exports/Imports (-)
Production of Crude Oil including Lease Condensate
Crude Oil Proved Reserves
Dry Natural Gas Production
Dry Natural Gas Consumption
Dry Natural Gas, Net Exports/Imports (-)
Proved Reserves of Natural Gas
Total Primary Coal Production
Total Coal Consumption
Coal, Net Exports/Imports (-)
Total Recoverable Coal
Total Electricity Net Generation
Total Electricity Net Consumption
Electricity, Net Exports/Imports (-)
Total Conventional Thermal Electricity Net Generation
Hydroelectricity Net Generation
Total Primary Energy Production
Total Primary Energy Consumption
Total Carbon Dioxide Emissions from the Consumption of Energy
Population