| Business / Energy Data |
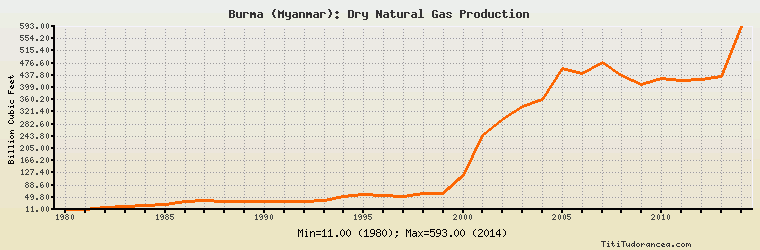
Burma (Myanmar): Dry Natural Gas Production
Billion Cubic Feet
| Year | Burma (Myanmar) | Change, percent | Burma (Myanmar), percent of Asia & Oceania | Burma (Myanmar), percent of World |
| 1980 | 11.000 | N/A | 0.447% | 0.021% |
| 1981 | 12.000 | 9.091% | 0.456% | 0.022% |
| 1982 | 16.000 | 33.333% | 0.594% | 0.029% |
| 1983 | 19.000 | 18.750% | 0.636% | 0.034% |
| 1984 | 23.000 | 21.053% | 0.654% | 0.038% |
| 1985 | 28.000 | 21.739% | 0.715% | 0.045% |
| 1986 | 38.000 | 35.714% | 0.900% | 0.060% |
| 1987 | 40.000 | 5.263% | 0.894% | 0.060% |
| 1988 | 37.000 | -7.500% | 0.767% | 0.053% |
| 1989 | 38.000 | 2.703% | 0.758% | 0.053% |
| 1990 | 38.000 | 0.000% | 0.683% | 0.052% |
| 1991 | 36.000 | -5.263% | 0.600% | 0.048% |
| 1992 | 36.000 | 0.000% | 0.570% | 0.048% |
| 1993 | 39.000 | 8.333% | 0.582% | 0.051% |
| 1994 | 51.000 | 30.769% | 0.704% | 0.066% |
| 1995 | 58.000 | 13.725% | 0.759% | 0.074% |
| 1996 | 57.000 | -1.724% | 0.684% | 0.071% |
| 1997 | 53.000 | -7.018% | 0.613% | 0.066% |
| 1998 | 62.000 | 16.981% | 0.712% | 0.076% |
| 1999 | 61.000 | -1.613% | 0.657% | 0.073% |
| 2000 | 120.000 | 96.721% | 1.252% | 0.138% |
| 2001 | 247.000 | 105.833% | 2.573% | 0.278% |
| 2002 | 297.000 | 20.243% | 2.886% | 0.328% |
| 2003 | 339.000 | 14.141% | 3.114% | 0.363% |
| 2004 | 360.000 | 6.195% | 3.199% | 0.376% |
| 2005 | 459.000 | 27.500% | 3.836% | 0.467% |
| 2006 | 445.000 | -3.050% | 3.451% | 0.438% |
| 2007 | 477.000 | 7.191% | 3.429% | 0.458% |
| 2008 | 438.000 | -8.176% | 3.018% | 0.406% |
| 2009 | 408.000 | -6.849% | 2.629% | 0.387% |
| 2010 | 427.000 | 4.657% | 2.459% | 0.380% |
| 2011 | 421.000 | -1.405% | 2.448% | 0.361% |
| 2012 | 424.000 | 0.713% | 2.441% | 0.355% |
| 2013 | 435.000 | 2.594% | 2.438% | 0.360% |
| 2014 | 593.000 | 36.322% | 3.218% | 0.485% |
Historical Energy Data about Burma (Myanmar)
Total Oil Supply
Total Consumption of Petroleum Products
Oil and Petroleum Products, Net Exports/Imports (-)
Production of Crude Oil including Lease Condensate
Crude Oil Proved Reserves
Dry Natural Gas Production
Dry Natural Gas Consumption
Dry Natural Gas, Net Exports/Imports (-)
Proved Reserves of Natural Gas
Total Primary Coal Production
Total Coal Consumption
Coal, Net Exports/Imports (-)
Total Recoverable Coal
Total Electricity Net Generation
Total Electricity Net Consumption
Electricity, Net Exports/Imports (-)
Total Conventional Thermal Electricity Net Generation
Hydroelectricity Net Generation
Total Primary Energy Production
Total Primary Energy Consumption
Total Carbon Dioxide Emissions from the Consumption of Energy
Population