| Business / Energy Data |
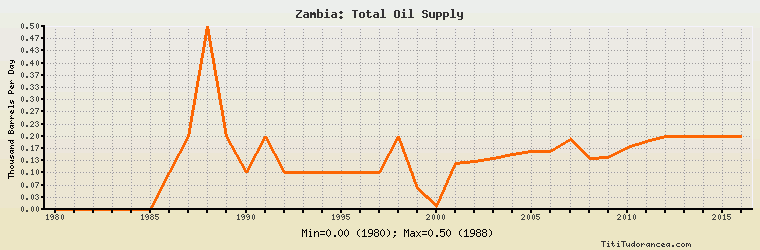
Zambia: Total Oil Supply
Thousand Barrels Per Day
| Year | Zambia | Change, percent | Zambia, percent of Africa | Zambia, percent of World |
| 1980 | 0.000 | N/A | 0.00% | 0.00% |
| 1981 | 0.000 | 0.000% | 0.00% | 0.00% |
| 1982 | 0.000 | 0.000% | 0.00% | 0.00% |
| 1983 | 0.000 | 0.000% | 0.00% | 0.00% |
| 1984 | 0.000 | 0.000% | 0.00% | 0.00% |
| 1985 | 0.000 | 0.000% | 0.00% | 0.00% |
| 1986 | 0.100 | 0.000% | 0.002% | 0.000% |
| 1987 | 0.200 | 100.000% | 0.004% | 0.000% |
| 1988 | 0.500 | 150.000% | 0.009% | 0.001% |
| 1989 | 0.200 | -60.000% | 0.003% | 0.000% |
| 1990 | 0.100 | -50.000% | 0.001% | 0.000% |
| 1991 | 0.200 | 100.000% | 0.003% | 0.000% |
| 1992 | 0.100 | -50.000% | 0.001% | 0.000% |
| 1993 | 0.100 | 0.000% | 0.001% | 0.000% |
| 1994 | 0.100 | 0.000% | 0.001% | 0.000% |
| 1995 | 0.100 | 0.000% | 0.001% | 0.000% |
| 1996 | 0.100 | 0.000% | 0.001% | 0.000% |
| 1997 | 0.100 | 0.000% | 0.001% | 0.000% |
| 1998 | 0.200 | 100.000% | 0.003% | 0.000% |
| 1999 | 0.058 | -71.000% | 0.001% | 0.000% |
| 2000 | 0.008 | -86.207% | 0.000% | 0.000% |
| 2001 | 0.126 | 1,475.000% | 0.002% | 0.000% |
| 2002 | 0.130 | 3.175% | 0.002% | 0.000% |
| 2003 | 0.140 | 7.692% | 0.002% | 0.000% |
| 2004 | 0.150 | 7.143% | 0.002% | 0.000% |
| 2005 | 0.159 | 6.000% | 0.002% | 0.000% |
| 2006 | 0.159 | 0.000% | 0.002% | 0.000% |
| 2007 | 0.190 | 19.497% | 0.002% | 0.000% |
| 2008 | 0.140 | -26.316% | 0.001% | 0.000% |
| 2009 | 0.142 | 1.429% | 0.001% | 0.000% |
| 2010 | 0.170 | 19.718% | 0.002% | 0.000% |
| 2011 | 0.186 | 9.412% | 0.002% | 0.000% |
| 2012 | 0.199 | 6.989% | 0.002% | 0.000% |
| 2013 | 0.199 | 0.000% | 0.002% | 0.000% |
| 2014 | 0.199 | 0.000% | 0.002% | 0.000% |
| 2015 | 0.199 | 0.000% | 0.002% | 0.000% |
| 2016 | 0.199 | 0.000% | 0.002% | 0.000% |
Historical Energy Data about Zambia
Total Oil Supply
Total Consumption of Petroleum Products
Oil and Petroleum Products, Net Exports/Imports (-)
Dry Natural Gas, Net Exports/Imports (-)
Total Primary Coal Production
Total Coal Consumption
Coal, Net Exports/Imports (-)
Total Recoverable Coal
Total Electricity Net Generation
Total Electricity Net Consumption
Total Electricity Exports
Total Electricity Imports
Electricity, Net Exports/Imports (-)
Total Conventional Thermal Electricity Net Generation
Hydroelectricity Net Generation
Total Primary Energy Production
Total Primary Energy Consumption
Total Carbon Dioxide Emissions from the Consumption of Energy
Population