| Business / Energy Data |
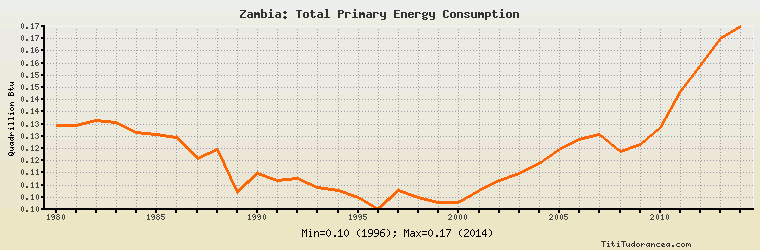
Zambia: Total Primary Energy Consumption
Quadrillion Btu
| Year | Zambia | Change, percent | Zambia, percent of Africa | Zambia, percent of World |
| 1980 | 0.131 | N/A | 1.977% | 0.046% |
| 1981 | 0.131 | 0.000% | 1.925% | 0.047% |
| 1982 | 0.133 | 1.527% | 1.801% | 0.048% |
| 1983 | 0.132 | -0.752% | 1.698% | 0.047% |
| 1984 | 0.128 | -3.030% | 1.569% | 0.043% |
| 1985 | 0.127 | -0.781% | 1.520% | 0.042% |
| 1986 | 0.126 | -0.787% | 1.481% | 0.040% |
| 1987 | 0.117 | -7.143% | 1.333% | 0.036% |
| 1988 | 0.121 | 3.419% | 1.332% | 0.036% |
| 1989 | 0.103 | -14.876% | 1.111% | 0.030% |
| 1990 | 0.111 | 7.767% | 1.157% | 0.032% |
| 1991 | 0.108 | -2.703% | 1.103% | 0.031% |
| 1992 | 0.109 | 0.926% | 1.120% | 0.032% |
| 1993 | 0.105 | -3.670% | 1.065% | 0.030% |
| 1994 | 0.104 | -0.952% | 1.029% | 0.030% |
| 1995 | 0.101 | -2.885% | 0.960% | 0.028% |
| 1996 | 0.096 | -4.950% | 0.882% | 0.026% |
| 1997 | 0.104 | 8.333% | 0.929% | 0.028% |
| 1998 | 0.101 | -2.885% | 0.888% | 0.027% |
| 1999 | 0.099 | -1.980% | 0.862% | 0.026% |
| 2000 | 0.099 | 0.000% | 0.823% | 0.025% |
| 2001 | 0.104 | 5.051% | 0.839% | 0.026% |
| 2002 | 0.108 | 3.846% | 0.844% | 0.027% |
| 2003 | 0.111 | 2.778% | 0.833% | 0.026% |
| 2004 | 0.115 | 3.604% | 0.833% | 0.026% |
| 2005 | 0.121 | 5.217% | 0.848% | 0.027% |
| 2006 | 0.125 | 3.306% | 0.861% | 0.027% |
| 2007 | 0.127 | 1.600% | 0.856% | 0.026% |
| 2008 | 0.120 | -5.512% | 0.750% | 0.025% |
| 2009 | 0.123 | 2.500% | 0.790% | 0.026% |
| 2010 | 0.130 | 5.691% | 0.793% | 0.026% |
| 2011 | 0.145 | 11.538% | 0.881% | 0.028% |
| 2012 | 0.156 | 7.586% | 0.879% | 0.029% |
| 2013 | 0.167 | 7.051% | 0.922% | 0.031% |
| 2014 | 0.172 | 2.994% | 0.916% | 0.032% |
Historical Energy Data about Zambia
Total Oil Supply
Total Consumption of Petroleum Products
Oil and Petroleum Products, Net Exports/Imports (-)
Dry Natural Gas, Net Exports/Imports (-)
Total Primary Coal Production
Total Coal Consumption
Coal, Net Exports/Imports (-)
Total Recoverable Coal
Total Electricity Net Generation
Total Electricity Net Consumption
Total Electricity Exports
Total Electricity Imports
Electricity, Net Exports/Imports (-)
Total Conventional Thermal Electricity Net Generation
Hydroelectricity Net Generation
Total Primary Energy Production
Total Primary Energy Consumption
Total Carbon Dioxide Emissions from the Consumption of Energy
Population