| Business / Energy Data |
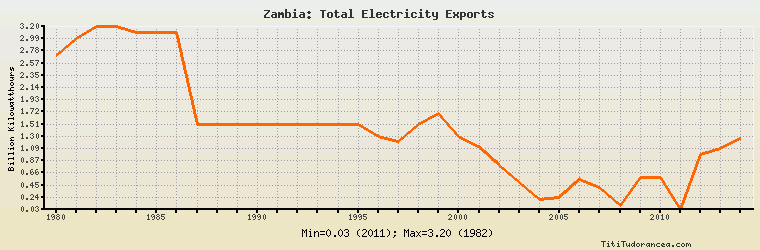
Zambia: Total Electricity Exports
Billion Kilowatthours
| Year | Zambia | Change, percent | Zambia, percent of Africa | Zambia, percent of World |
| 1980 | 2.700 | N/A | 77.143% | 1.817% |
| 1981 | 3.000 | 11.111% | 71.056% | 1.805% |
| 1982 | 3.200 | 6.667% | 65.520% | 1.946% |
| 1983 | 3.200 | 0.000% | 77.183% | 1.650% |
| 1984 | 3.100 | -3.125% | 69.058% | 1.534% |
| 1985 | 3.100 | 0.000% | 75.024% | 1.435% |
| 1986 | 3.100 | 0.000% | 76.242% | 1.433% |
| 1987 | 1.500 | -51.613% | 61.856% | 0.602% |
| 1988 | 1.500 | 0.000% | 64.599% | 0.581% |
| 1989 | 1.500 | 0.000% | 57.604% | 0.539% |
| 1990 | 1.500 | 0.000% | 37.332% | 0.514% |
| 1991 | 1.500 | 0.000% | 29.458% | 0.575% |
| 1992 | 1.500 | 0.000% | 23.306% | 0.374% |
| 1993 | 1.500 | 0.000% | 19.934% | 0.374% |
| 1994 | 1.500 | 0.000% | 21.207% | 0.373% |
| 1995 | 1.500 | 0.000% | 21.340% | 0.374% |
| 1996 | 1.300 | -13.333% | 13.416% | 0.302% |
| 1997 | 1.200 | -7.692% | 11.058% | 0.283% |
| 1998 | 1.500 | 25.000% | 15.934% | 0.361% |
| 1999 | 1.700 | 13.333% | 11.524% | 0.377% |
| 2000 | 1.300 | -23.529% | 8.743% | 0.261% |
| 2001 | 1.100 | -15.385% | 5.763% | 0.222% |
| 2002 | 0.800 | -27.273% | 3.418% | 0.154% |
| 2003 | 0.500 | -37.500% | 2.064% | 0.091% |
| 2004 | 0.200 | -60.000% | 0.696% | 0.036% |
| 2005 | 0.243 | 21.500% | 0.786% | 0.040% |
| 2006 | 0.552 | 127.160% | 1.755% | 0.089% |
| 2007 | 0.417 | -24.457% | 1.368% | 0.066% |
| 2008 | 0.096 | -76.978% | 0.327% | 0.016% |
| 2009 | 0.589 | 513.542% | 1.821% | 0.101% |
| 2010 | 0.578 | -1.868% | 1.686% | 0.098% |
| 2011 | 0.029 | -94.983% | 0.088% | 0.005% |
| 2012 | 0.980 | 3,279.310% | 3.158% | 0.145% |
| 2013 | 1.083 | 10.510% | 3.800% | 0.161% |
| 2014 | 1.256 | 15.974% | 4.028% | 0.179% |
Historical Energy Data about Zambia
Total Oil Supply
Total Consumption of Petroleum Products
Oil and Petroleum Products, Net Exports/Imports (-)
Dry Natural Gas, Net Exports/Imports (-)
Total Primary Coal Production
Total Coal Consumption
Coal, Net Exports/Imports (-)
Total Recoverable Coal
Total Electricity Net Generation
Total Electricity Net Consumption
Total Electricity Exports
Total Electricity Imports
Electricity, Net Exports/Imports (-)
Total Conventional Thermal Electricity Net Generation
Hydroelectricity Net Generation
Total Primary Energy Production
Total Primary Energy Consumption
Total Carbon Dioxide Emissions from the Consumption of Energy
Population