| Business / Energy Data |
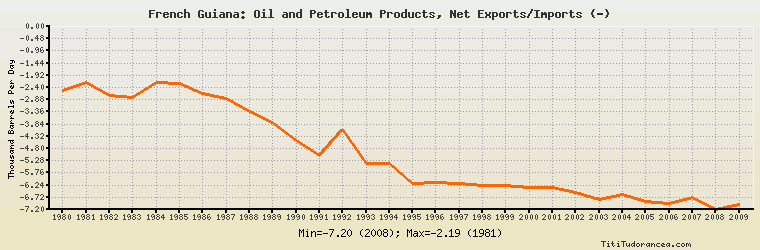
French Guiana: Oil and Petroleum Products, Net Exports/Imports (-)
Thousand Barrels Per Day
| Year | French Guiana | Change, percent | French Guiana, percent of Central & South America | French Guiana, percent of World |
| 1980 | -2.520 | N/A | -0.457% | N/A |
| 1981 | -2.190 | -13.095% | -0.725% | N/A |
| 1982 | -2.720 | 24.201% | -1.030% | N/A |
| 1983 | -2.800 | 2.941% | -0.634% | N/A |
| 1984 | -2.220 | -20.714% | -0.356% | N/A |
| 1985 | -2.234 | 0.631% | -0.325% | N/A |
| 1986 | -2.621 | 17.323% | -0.384% | N/A |
| 1987 | -2.830 | 7.974% | -0.556% | N/A |
| 1988 | -3.335 | 17.845% | -0.473% | N/A |
| 1989 | -3.763 | 12.834% | -0.509% | N/A |
| 1990 | -4.501 | 19.612% | -0.483% | N/A |
| 1991 | -5.082 | 12.908% | -0.456% | N/A |
| 1992 | -4.041 | -20.484% | -0.367% | N/A |
| 1993 | -5.395 | 33.507% | -0.444% | N/A |
| 1994 | -5.395 | 0.000% | -0.384% | N/A |
| 1995 | -6.163 | 14.235% | -0.374% | N/A |
| 1996 | -6.147 | -0.260% | -0.333% | N/A |
| 1997 | -6.163 | 0.260% | -0.292% | N/A |
| 1998 | -6.268 | 1.704% | -0.305% | N/A |
| 1999 | -6.268 | 0.000% | -0.347% | N/A |
| 2000 | -6.336 | 1.085% | -0.313% | N/A |
| 2001 | -6.354 | 0.284% | -0.336% | N/A |
| 2002 | -6.528 | 2.738% | -0.383% | N/A |
| 2003 | -6.811 | 4.335% | -0.456% | N/A |
| 2004 | -6.618 | -2.834% | -0.417% | N/A |
| 2005 | -6.893 | 4.155% | -0.422% | N/A |
| 2006 | -6.954 | 0.885% | -0.467% | N/A |
| 2007 | -6.709 | -3.523% | -0.499% | N/A |
| 2008 | -7.200 | 7.319% | -0.432% | N/A |
| 2009 | -7.000 | -2.778% | -0.455% | N/A |
Historical Energy Data about French Guiana
Total Consumption of Petroleum Products
Oil and Petroleum Products, Net Exports/Imports (-)
Dry Natural Gas, Net Exports/Imports (-)
Coal, Net Exports/Imports (-)
Total Electricity Net Generation
Total Electricity Net Consumption
Electricity, Net Exports/Imports (-)
Total Conventional Thermal Electricity Net Generation
Total Primary Energy Consumption
Total Carbon Dioxide Emissions from the Consumption of Energy