| Business / Energy Data |
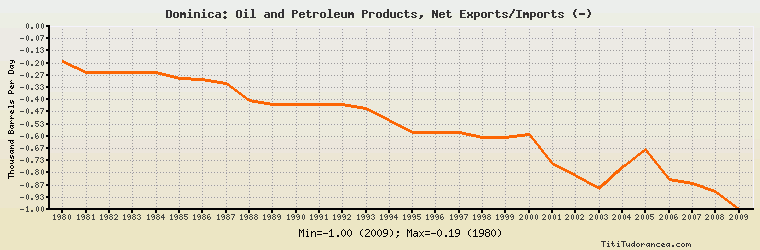
Dominica: Oil and Petroleum Products, Net Exports/Imports (-)
Thousand Barrels Per Day
| Year | Dominica | Change, percent | Dominica, percent of Central & South America | Dominica, percent of World |
| 1980 | -0.190 | N/A | -0.034% | N/A |
| 1981 | -0.250 | 31.579% | -0.083% | N/A |
| 1982 | -0.250 | 0.000% | -0.095% | N/A |
| 1983 | -0.250 | 0.000% | -0.057% | N/A |
| 1984 | -0.250 | 0.000% | -0.040% | N/A |
| 1985 | -0.286 | 14.400% | -0.042% | N/A |
| 1986 | -0.287 | 0.350% | -0.042% | N/A |
| 1987 | -0.310 | 8.014% | -0.061% | N/A |
| 1988 | -0.403 | 30.000% | -0.057% | N/A |
| 1989 | -0.428 | 6.203% | -0.058% | N/A |
| 1990 | -0.428 | 0.000% | -0.046% | N/A |
| 1991 | -0.428 | 0.000% | -0.038% | N/A |
| 1992 | -0.426 | -0.467% | -0.039% | N/A |
| 1993 | -0.448 | 5.164% | -0.037% | N/A |
| 1994 | -0.516 | 15.179% | -0.037% | N/A |
| 1995 | -0.579 | 12.209% | -0.035% | N/A |
| 1996 | -0.579 | 0.000% | -0.031% | N/A |
| 1997 | -0.581 | 0.345% | -0.027% | N/A |
| 1998 | -0.604 | 3.959% | -0.029% | N/A |
| 1999 | -0.604 | 0.000% | -0.033% | N/A |
| 2000 | -0.589 | -2.483% | -0.029% | N/A |
| 2001 | -0.748 | 26.995% | -0.040% | N/A |
| 2002 | -0.816 | 9.091% | -0.048% | N/A |
| 2003 | -0.883 | 8.211% | -0.059% | N/A |
| 2004 | -0.772 | -12.571% | -0.049% | N/A |
| 2005 | -0.670 | -13.212% | -0.041% | N/A |
| 2006 | -0.838 | 25.075% | -0.056% | N/A |
| 2007 | -0.859 | 2.506% | -0.064% | N/A |
| 2008 | -0.900 | 4.773% | -0.054% | N/A |
| 2009 | -1.000 | 11.111% | -0.065% | N/A |
Historical Energy Data about Dominica
Total Consumption of Petroleum Products
Oil and Petroleum Products, Net Exports/Imports (-)
Dry Natural Gas, Net Exports/Imports (-)
Coal, Net Exports/Imports (-)
Total Electricity Net Generation
Total Electricity Net Consumption
Electricity, Net Exports/Imports (-)
Total Conventional Thermal Electricity Net Generation
Hydroelectricity Net Generation
Total Primary Energy Consumption
Total Carbon Dioxide Emissions from the Consumption of Energy
Population