| Business / Energy Data |
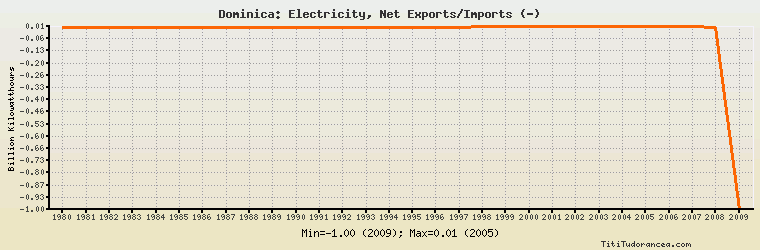
Dominica: Electricity, Net Exports/Imports (-)
Billion Kilowatthours
| Year | Dominica | Change, percent | Dominica, percent of Central & South America | Dominica, percent of World |
| 1980 | 0.001 | N/A | 1.000% | N/A |
| 1981 | 0.001 | 0.000% | 0.709% | N/A |
| 1982 | 0.001 | 0.000% | -0.794% | N/A |
| 1983 | 0.001 | 0.000% | 0.439% | N/A |
| 1984 | 0.002 | 100.000% | 2.105% | N/A |
| 1985 | 0.002 | 0.000% | 0.075% | N/A |
| 1986 | 0.002 | 0.000% | 1.575% | N/A |
| 1987 | 0.002 | 0.000% | 0.418% | N/A |
| 1988 | 0.002 | 0.000% | 1.290% | N/A |
| 1989 | 0.002 | 0.000% | -0.141% | N/A |
| 1990 | 0.002 | 0.000% | 1.449% | N/A |
| 1991 | 0.002 | 0.000% | 1.026% | N/A |
| 1992 | 0.002 | 0.000% | 40.000% | N/A |
| 1993 | 0.002 | 0.000% | - | N/A |
| 1994 | 0.002 | 0.000% | - | N/A |
| 1995 | 0.003 | 50.000% | 7.692% | N/A |
| 1996 | 0.003 | 0.000% | -0.112% | N/A |
| 1997 | 0.003 | 0.000% | 2.479% | N/A |
| 1998 | 0.004 | 33.333% | -2.469% | N/A |
| 1999 | 0.005 | 25.000% | 17.857% | N/A |
| 2000 | 0.005 | 0.000% | 0.386% | N/A |
| 2001 | 0.005 | 0.000% | -0.480% | N/A |
| 2002 | 0.005 | 0.000% | 12.821% | N/A |
| 2003 | 0.005 | 0.000% | 0.765% | N/A |
| 2004 | 0.005 | 0.000% | -1.176% | N/A |
| 2005 | 0.006 | 20.000% | -0.391% | N/A |
| 2006 | 0.006 | 0.000% | -0.438% | N/A |
| 2007 | 0.006 | 0.000% | -0.250% | N/A |
| 2008 | 0.000 | -100.000% | 0.00% | N/A |
| 2009 | -1.000 | 0.000% | 26.596% | N/A |
Historical Energy Data about Dominica
Total Consumption of Petroleum Products
Oil and Petroleum Products, Net Exports/Imports (-)
Dry Natural Gas, Net Exports/Imports (-)
Coal, Net Exports/Imports (-)
Total Electricity Net Generation
Total Electricity Net Consumption
Electricity, Net Exports/Imports (-)
Total Conventional Thermal Electricity Net Generation
Hydroelectricity Net Generation
Total Primary Energy Consumption
Total Carbon Dioxide Emissions from the Consumption of Energy
Population