| Business / Energy Data |
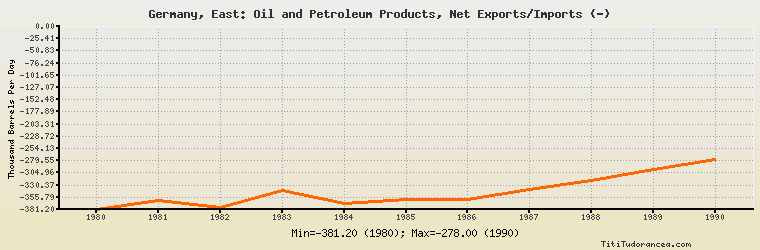
Germany, East: Oil and Petroleum Products, Net Exports/Imports (-)
Thousand Barrels Per Day
| Year | Germany, East | Change, percent | Germany, East, percent of Europe | Germany, East, percent of World |
| 1980 | -381.200 | N/A | 2.930% | N/A |
| 1981 | -361.600 | -5.142% | 3.128% | N/A |
| 1982 | -378.000 | 4.535% | 3.551% | N/A |
| 1983 | -342.600 | -9.365% | 3.499% | N/A |
| 1984 | -368.100 | 7.443% | 3.937% | N/A |
| 1985 | -361.400 | -1.820% | 3.949% | N/A |
| 1986 | -360.900 | -0.138% | 3.828% | N/A |
| 1987 | -340.200 | -5.736% | 3.574% | N/A |
| 1988 | -319.800 | -5.996% | 3.291% | N/A |
| 1989 | -297.500 | -6.973% | 3.014% | N/A |
| 1990 | -278.000 | -6.555% | 2.815% | N/A |
Historical Energy Data about Germany, East
Total Oil Supply
Total Consumption of Petroleum Products
Oil and Petroleum Products, Net Exports/Imports (-)
Production of Crude Oil including Lease Condensate
Dry Natural Gas Production
Dry Natural Gas Consumption
Dry Natural Gas, Net Exports/Imports (-)
Total Primary Coal Production
Total Coal Consumption
Coal, Net Exports/Imports (-)
Total Electricity Net Generation
Total Electricity Net Consumption
Total Electricity Exports
Total Electricity Imports
Electricity, Net Exports/Imports (-)
Total Conventional Thermal Electricity Net Generation
Nuclear Electricity Net Generation
Hydroelectricity Net Generation
Total Primary Energy Production
Total Primary Energy Consumption
Total Carbon Dioxide Emissions from the Consumption of Energy