| Business / Energy Data |
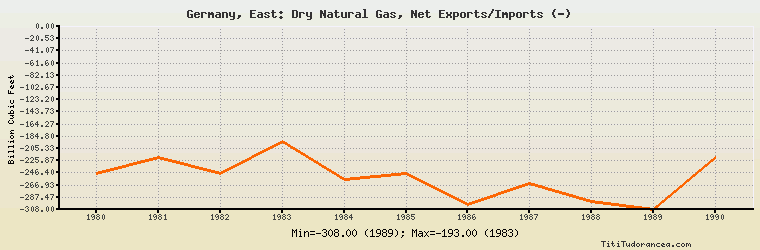
Germany, East: Dry Natural Gas, Net Exports/Imports (-)
Billion Cubic Feet
| Year | Germany, East | Change, percent | Germany, East, percent of Europe | Germany, East, percent of World |
| 1980 | -247.000 | N/A | 12.060% | N/A |
| 1981 | -221.000 | -10.526% | 10.910% | N/A |
| 1982 | -248.000 | 12.217% | 9.849% | N/A |
| 1983 | -193.000 | -22.177% | 7.971% | N/A |
| 1984 | -258.000 | 33.679% | 8.782% | N/A |
| 1985 | -248.000 | -3.876% | 8.006% | N/A |
| 1986 | -299.000 | 20.565% | 8.382% | N/A |
| 1987 | -264.000 | -11.706% | 6.951% | N/A |
| 1988 | -295.000 | 11.742% | 7.553% | N/A |
| 1989 | -308.000 | 4.407% | 6.909% | N/A |
| 1990 | -221.000 | -28.247% | 4.638% | N/A |
Historical Energy Data about Germany, East
Total Oil Supply
Total Consumption of Petroleum Products
Oil and Petroleum Products, Net Exports/Imports (-)
Production of Crude Oil including Lease Condensate
Dry Natural Gas Production
Dry Natural Gas Consumption
Dry Natural Gas, Net Exports/Imports (-)
Total Primary Coal Production
Total Coal Consumption
Coal, Net Exports/Imports (-)
Total Electricity Net Generation
Total Electricity Net Consumption
Total Electricity Exports
Total Electricity Imports
Electricity, Net Exports/Imports (-)
Total Conventional Thermal Electricity Net Generation
Nuclear Electricity Net Generation
Hydroelectricity Net Generation
Total Primary Energy Production
Total Primary Energy Consumption
Total Carbon Dioxide Emissions from the Consumption of Energy