| Business / Energy Data |
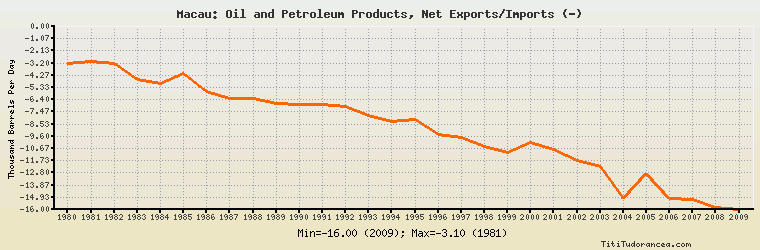
Macau: Oil and Petroleum Products, Net Exports/Imports (-)
Thousand Barrels Per Day
| Year | Macau | Change, percent | Macau, percent of Asia & Oceania | Macau, percent of World |
| 1980 | -3.220 | N/A | 0.057% | N/A |
| 1981 | -3.100 | -3.727% | 0.056% | N/A |
| 1982 | -3.270 | 5.484% | 0.060% | N/A |
| 1983 | -4.610 | 40.979% | 0.090% | N/A |
| 1984 | -5.000 | 8.460% | 0.098% | N/A |
| 1985 | -4.101 | -17.980% | 0.087% | N/A |
| 1986 | -5.673 | 38.332% | 0.115% | N/A |
| 1987 | -6.311 | 11.246% | 0.119% | N/A |
| 1988 | -6.277 | -0.539% | 0.104% | N/A |
| 1989 | -6.728 | 7.185% | 0.102% | N/A |
| 1990 | -6.788 | 0.892% | 0.096% | N/A |
| 1991 | -6.826 | 0.560% | 0.091% | N/A |
| 1992 | -7.031 | 3.003% | 0.085% | N/A |
| 1993 | -7.777 | 10.610% | 0.087% | N/A |
| 1994 | -8.287 | 6.558% | 0.084% | N/A |
| 1995 | -8.112 | -2.112% | 0.078% | N/A |
| 1996 | -9.417 | 16.087% | 0.086% | N/A |
| 1997 | -9.681 | 2.803% | 0.084% | N/A |
| 1998 | -10.455 | 7.995% | 0.093% | N/A |
| 1999 | -11.055 | 5.739% | 0.091% | N/A |
| 2000 | -10.117 | -8.485% | 0.081% | N/A |
| 2001 | -10.726 | 6.020% | 0.085% | N/A |
| 2002 | -11.726 | 9.323% | 0.089% | N/A |
| 2003 | -12.261 | 4.563% | 0.086% | N/A |
| 2004 | -15.030 | 22.584% | 0.097% | N/A |
| 2005 | -12.861 | -14.431% | 0.081% | N/A |
| 2006 | -15.076 | 17.223% | 0.093% | N/A |
| 2007 | -15.166 | 0.597% | 0.090% | N/A |
| 2008 | -15.800 | 4.180% | 0.096% | N/A |
| 2009 | -16.000 | 1.266% | 0.093% | N/A |
Historical Energy Data about Macau
Total Consumption of Petroleum Products
Oil and Petroleum Products, Net Exports/Imports (-)
Dry Natural Gas, Net Exports/Imports (-)
Total Coal Consumption
Coal, Net Exports/Imports (-)
Total Electricity Net Generation
Total Electricity Net Consumption
Total Electricity Exports
Total Electricity Imports
Electricity, Net Exports/Imports (-)
Total Conventional Thermal Electricity Net Generation
Total Primary Energy Consumption
Total Carbon Dioxide Emissions from the Consumption of Energy
Population