| Business / Energy Data |
Montserrat: Oil and Petroleum Products, Net Exports/Imports (-)
Thousand Barrels Per Day
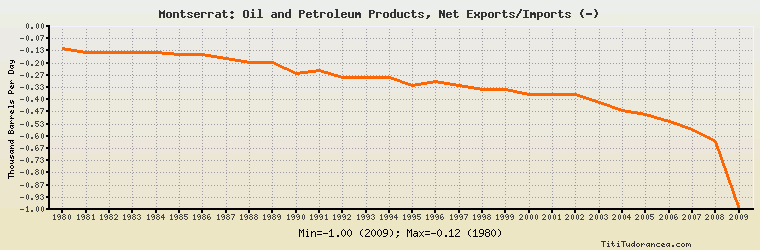
| Year | Montserrat | Change, percent | Montserrat, percent of Central & South America | Montserrat, percent of World |
| 1980 | -0.120 | N/A | -0.022% | N/A |
| 1981 | -0.140 | 16.667% | -0.046% | N/A |
| 1982 | -0.140 | 0.000% | -0.053% | N/A |
| 1983 | -0.140 | 0.000% | -0.032% | N/A |
| 1984 | -0.140 | 0.000% | -0.022% | N/A |
| 1985 | -0.152 | 8.571% | -0.022% | N/A |
| 1986 | -0.152 | 0.000% | -0.022% | N/A |
| 1987 | -0.173 | 13.816% | -0.034% | N/A |
| 1988 | -0.196 | 13.295% | -0.028% | N/A |
| 1989 | -0.196 | 0.000% | -0.026% | N/A |
| 1990 | -0.258 | 31.633% | -0.028% | N/A |
| 1991 | -0.240 | -6.977% | -0.022% | N/A |
| 1992 | -0.280 | 16.667% | -0.025% | N/A |
| 1993 | -0.281 | 0.357% | -0.023% | N/A |
| 1994 | -0.281 | 0.000% | -0.020% | N/A |
| 1995 | -0.325 | 15.658% | -0.020% | N/A |
| 1996 | -0.301 | -7.385% | -0.016% | N/A |
| 1997 | -0.322 | 6.977% | -0.015% | N/A |
| 1998 | -0.345 | 7.143% | -0.017% | N/A |
| 1999 | -0.345 | 0.000% | -0.019% | N/A |
| 2000 | -0.371 | 7.536% | -0.018% | N/A |
| 2001 | -0.372 | 0.270% | -0.020% | N/A |
| 2002 | -0.372 | 0.000% | -0.022% | N/A |
| 2003 | -0.415 | 11.559% | -0.028% | N/A |
| 2004 | -0.458 | 10.361% | -0.029% | N/A |
| 2005 | -0.483 | 5.459% | -0.030% | N/A |
| 2006 | -0.521 | 7.867% | -0.035% | N/A |
| 2007 | -0.564 | 8.253% | -0.042% | N/A |
| 2008 | -0.630 | 11.702% | -0.038% | N/A |
| 2009 | -1.000 | 58.730% | -0.065% | N/A |
Historical Energy Data about Montserrat
Total Consumption of Petroleum Products
Oil and Petroleum Products, Net Exports/Imports (-)
Dry Natural Gas, Net Exports/Imports (-)
Coal, Net Exports/Imports (-)
Total Electricity Net Generation
Total Electricity Net Consumption
Electricity, Net Exports/Imports (-)
Total Conventional Thermal Electricity Net Generation
Total Primary Energy Consumption
Total Carbon Dioxide Emissions from the Consumption of Energy
Population