| Business / Energy Data |
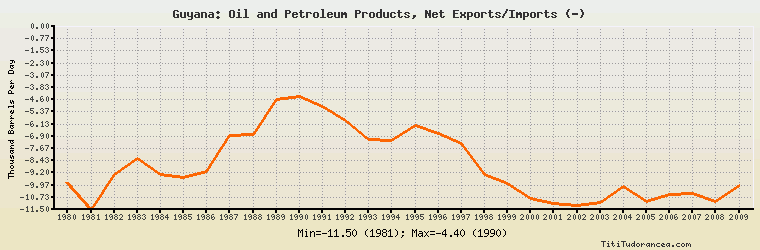
Guyana: Oil and Petroleum Products, Net Exports/Imports (-)
Thousand Barrels Per Day
| Year | Guyana | Change, percent | Guyana, percent of Central & South America | Guyana, percent of World |
| 1980 | -9.800 | N/A | -1.776% | N/A |
| 1981 | -11.500 | 17.347% | -3.807% | N/A |
| 1982 | -9.300 | -19.130% | -3.523% | N/A |
| 1983 | -8.300 | -10.753% | -1.880% | N/A |
| 1984 | -9.300 | 12.048% | -1.492% | N/A |
| 1985 | -9.475 | 1.882% | -1.377% | N/A |
| 1986 | -9.087 | -4.095% | -1.331% | N/A |
| 1987 | -6.841 | -24.717% | -1.343% | N/A |
| 1988 | -6.801 | -0.585% | -0.964% | N/A |
| 1989 | -4.587 | -32.554% | -0.620% | N/A |
| 1990 | -4.400 | -4.077% | -0.472% | N/A |
| 1991 | -5.000 | 13.636% | -0.449% | N/A |
| 1992 | -5.876 | 17.520% | -0.534% | N/A |
| 1993 | -7.131 | 21.358% | -0.587% | N/A |
| 1994 | -7.141 | 0.140% | -0.508% | N/A |
| 1995 | -6.238 | -12.645% | -0.379% | N/A |
| 1996 | -6.717 | 7.679% | -0.364% | N/A |
| 1997 | -7.363 | 9.617% | -0.348% | N/A |
| 1998 | -9.291 | 26.185% | -0.452% | N/A |
| 1999 | -9.857 | 6.092% | -0.546% | N/A |
| 2000 | -10.810 | 9.668% | -0.534% | N/A |
| 2001 | -11.098 | 2.664% | -0.586% | N/A |
| 2002 | -11.273 | 1.577% | -0.662% | N/A |
| 2003 | -11.079 | -1.721% | -0.742% | N/A |
| 2004 | -10.069 | -9.116% | -0.635% | N/A |
| 2005 | -10.986 | 9.107% | -0.673% | N/A |
| 2006 | -10.548 | -3.987% | -0.709% | N/A |
| 2007 | -10.478 | -0.664% | -0.780% | N/A |
| 2008 | -11.000 | 4.982% | -0.661% | N/A |
| 2009 | -10.000 | -9.091% | -0.651% | N/A |
Historical Energy Data about Guyana
Total Consumption of Petroleum Products
Oil and Petroleum Products, Net Exports/Imports (-)
Dry Natural Gas, Net Exports/Imports (-)
Coal, Net Exports/Imports (-)
Total Electricity Net Generation
Total Electricity Net Consumption
Total Electricity Imports
Electricity, Net Exports/Imports (-)
Total Conventional Thermal Electricity Net Generation
Hydroelectricity Net Generation
Total Primary Energy Consumption
Total Carbon Dioxide Emissions from the Consumption of Energy
Population