| Business / Energy Data |
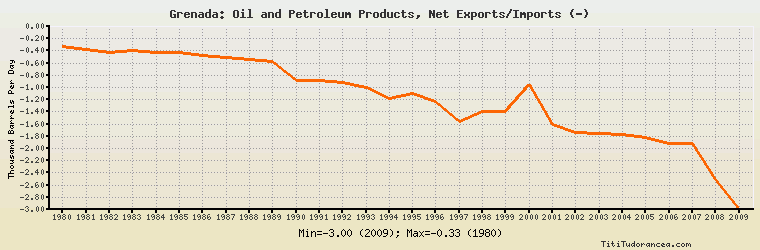
Grenada: Oil and Petroleum Products, Net Exports/Imports (-)
Thousand Barrels Per Day
| Year | Grenada | Change, percent | Grenada, percent of Central & South America | Grenada, percent of World |
| 1980 | -0.330 | N/A | -0.060% | N/A |
| 1981 | -0.380 | 15.152% | -0.126% | N/A |
| 1982 | -0.420 | 10.526% | -0.159% | N/A |
| 1983 | -0.400 | -4.762% | -0.091% | N/A |
| 1984 | -0.420 | 5.000% | -0.067% | N/A |
| 1985 | -0.430 | 2.381% | -0.062% | N/A |
| 1986 | -0.473 | 10.000% | -0.069% | N/A |
| 1987 | -0.507 | 7.188% | -0.100% | N/A |
| 1988 | -0.544 | 7.298% | -0.077% | N/A |
| 1989 | -0.566 | 4.044% | -0.076% | N/A |
| 1990 | -0.888 | 56.890% | -0.095% | N/A |
| 1991 | -0.888 | 0.000% | -0.080% | N/A |
| 1992 | -0.910 | 2.477% | -0.083% | N/A |
| 1993 | -0.999 | 9.780% | -0.082% | N/A |
| 1994 | -1.178 | 17.918% | -0.084% | N/A |
| 1995 | -1.099 | -6.706% | -0.067% | N/A |
| 1996 | -1.234 | 12.284% | -0.067% | N/A |
| 1997 | -1.550 | 25.608% | -0.073% | N/A |
| 1998 | -1.387 | -10.516% | -0.068% | N/A |
| 1999 | -1.387 | 0.000% | -0.077% | N/A |
| 2000 | -0.957 | -31.002% | -0.047% | N/A |
| 2001 | -1.606 | 67.816% | -0.085% | N/A |
| 2002 | -1.745 | 8.655% | -0.102% | N/A |
| 2003 | -1.759 | 0.802% | -0.118% | N/A |
| 2004 | -1.776 | 0.966% | -0.112% | N/A |
| 2005 | -1.820 | 2.477% | -0.111% | N/A |
| 2006 | -1.923 | 5.659% | -0.129% | N/A |
| 2007 | -1.913 | -0.520% | -0.142% | N/A |
| 2008 | -2.500 | 30.685% | -0.150% | N/A |
| 2009 | -3.000 | 20.000% | -0.195% | N/A |
Historical Energy Data about Grenada
Total Consumption of Petroleum Products
Oil and Petroleum Products, Net Exports/Imports (-)
Dry Natural Gas, Net Exports/Imports (-)
Coal, Net Exports/Imports (-)
Total Electricity Net Generation
Total Electricity Net Consumption
Electricity, Net Exports/Imports (-)
Total Conventional Thermal Electricity Net Generation
Total Primary Energy Consumption
Total Carbon Dioxide Emissions from the Consumption of Energy
Population