| Business / Energy Data |
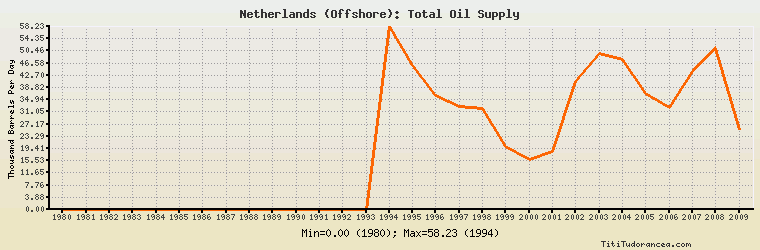
Netherlands (Offshore): Total Oil Supply
Thousand Barrels Per Day
| Year | Netherlands (Offshore) | Change, percent | Netherlands (Offshore), percent of Europe | Netherlands (Offshore), percent of World |
| 1980 | 0.000 | N/A | 0.00% | 0.00% |
| 1981 | 0.000 | 0.000% | 0.00% | 0.00% |
| 1982 | 0.000 | 0.000% | 0.00% | 0.00% |
| 1983 | 0.000 | 0.000% | 0.00% | 0.00% |
| 1984 | 0.000 | 0.000% | 0.00% | 0.00% |
| 1985 | 0.000 | 0.000% | 0.00% | 0.00% |
| 1986 | 0.000 | 0.000% | 0.00% | 0.00% |
| 1987 | 0.000 | 0.000% | 0.00% | 0.00% |
| 1988 | 0.000 | 0.000% | 0.00% | 0.00% |
| 1989 | 0.000 | 0.000% | 0.00% | 0.00% |
| 1990 | 0.000 | 0.000% | 0.00% | 0.00% |
| 1991 | 0.000 | 0.000% | 0.00% | 0.00% |
| 1992 | 0.000 | 0.000% | 0.00% | 0.00% |
| 1993 | 0.000 | 0.000% | 0.00% | 0.00% |
| 1994 | 58.227 | 0.000% | 0.892% | 0.085% |
| 1995 | 45.973 | -21.045% | 0.669% | 0.065% |
| 1996 | 36.238 | -21.175% | 0.497% | 0.050% |
| 1997 | 32.742 | -9.647% | 0.449% | 0.044% |
| 1998 | 32.000 | -2.266% | 0.443% | 0.042% |
| 1999 | 20.000 | -37.500% | 0.274% | 0.027% |
| 2000 | 16.000 | -20.000% | 0.223% | 0.021% |
| 2001 | 18.326 | 14.538% | 0.254% | 0.024% |
| 2002 | 40.759 | 122.411% | 0.568% | 0.053% |
| 2003 | 49.776 | 22.123% | 0.715% | 0.063% |
| 2004 | 47.628 | -4.315% | 0.723% | 0.057% |
| 2005 | 36.984 | -22.348% | 0.600% | 0.043% |
| 2006 | 32.575 | -11.921% | 0.564% | 0.038% |
| 2007 | 43.893 | 34.744% | 0.806% | 0.051% |
| 2008 | 51.085 | 16.385% | 0.978% | 0.059% |
| 2009 | 25.564 | -49.958% | 0.513% | 0.030% |
| 2010 | N/A | N/A | N/A | N/A |
Historical Energy Data about Netherlands (Offshore)
Total Oil Supply
Production of Crude Oil including Lease Condensate