| Business / Energy Data |
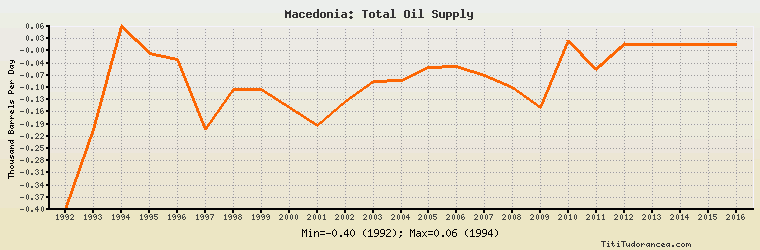
Macedonia: Total Oil Supply
Thousand Barrels Per Day
| Year | Macedonia | Change, percent | Macedonia, percent of Europe | Macedonia, percent of World |
| 1980 | N/A | N/A | N/A | N/A |
| 1981 | N/A | N/A | N/A | N/A |
| 1982 | N/A | N/A | N/A | N/A |
| 1983 | N/A | N/A | N/A | N/A |
| 1984 | N/A | N/A | N/A | N/A |
| 1985 | N/A | N/A | N/A | N/A |
| 1986 | N/A | N/A | N/A | N/A |
| 1987 | N/A | N/A | N/A | N/A |
| 1988 | N/A | N/A | N/A | N/A |
| 1989 | N/A | N/A | N/A | N/A |
| 1990 | N/A | N/A | N/A | N/A |
| 1991 | N/A | N/A | N/A | N/A |
| 1992 | -0.400 | N/A | -0.007% | -0.001% |
| 1993 | -0.200 | -50.000% | -0.004% | -0.000% |
| 1994 | 0.056 | -128.000% | 0.001% | 0.000% |
| 1995 | -0.012 | -121.429% | -0.000% | -0.000% |
| 1996 | -0.025 | 108.333% | -0.000% | -0.000% |
| 1997 | -0.200 | 700.000% | -0.003% | -0.000% |
| 1998 | -0.100 | -50.000% | -0.001% | -0.000% |
| 1999 | -0.100 | 0.000% | -0.001% | -0.000% |
| 2000 | -0.146 | 46.000% | -0.002% | -0.000% |
| 2001 | -0.190 | 30.137% | -0.003% | -0.000% |
| 2002 | -0.130 | -31.579% | -0.002% | -0.000% |
| 2003 | -0.080 | -38.462% | -0.001% | -0.000% |
| 2004 | -0.078 | -2.500% | -0.001% | -0.000% |
| 2005 | -0.045 | -42.308% | -0.001% | -0.000% |
| 2006 | -0.044 | -2.222% | -0.001% | -0.000% |
| 2007 | -0.066 | 50.000% | -0.001% | -0.000% |
| 2008 | -0.097 | 46.970% | -0.002% | -0.000% |
| 2009 | -0.146 | 50.515% | -0.003% | -0.000% |
| 2010 | 0.020 | -113.699% | 0.000% | 0.000% |
| 2011 | -0.050 | -350.000% | -0.001% | -0.000% |
| 2012 | 0.010 | -120.000% | 0.000% | 0.000% |
| 2013 | 0.010 | 0.000% | 0.000% | 0.000% |
| 2014 | 0.010 | 0.000% | 0.000% | 0.000% |
| 2015 | 0.010 | 0.000% | 0.000% | 0.000% |
| 2016 | 0.010 | 0.000% | 0.000% | 0.000% |
Historical Energy Data about Macedonia
Total Oil Supply
Total Consumption of Petroleum Products
Oil and Petroleum Products, Net Exports/Imports (-)
Dry Natural Gas Consumption
Dry Natural Gas, Net Exports/Imports (-)
Total Primary Coal Production
Total Coal Consumption
Coal, Net Exports/Imports (-)
Total Electricity Net Generation
Total Electricity Net Consumption
Total Electricity Exports
Total Electricity Imports
Electricity, Net Exports/Imports (-)
Total Conventional Thermal Electricity Net Generation
Hydroelectricity Net Generation
Total Biofuels Production
Total Primary Energy Production
Total Primary Energy Consumption
Total Carbon Dioxide Emissions from the Consumption of Energy
Population