| Business / Energy Data |
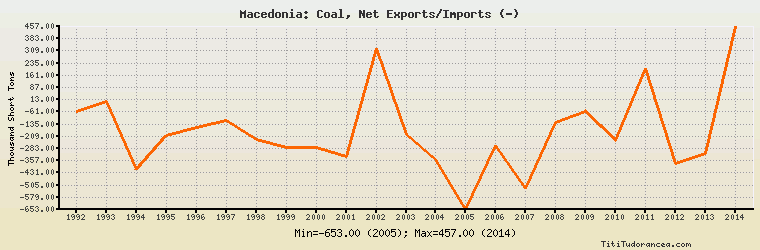
Macedonia: Coal, Net Exports/Imports (-)
Thousand Short Tons
| Year | Macedonia | Change, percent | Macedonia, percent of Europe | Macedonia, percent of World |
| 1992 | -57.000 | N/A | 0.037% | N/A |
| 1993 | 3.000 | -105.263% | -0.002% | N/A |
| 1994 | -413.000 | -13,866.667% | 0.244% | N/A |
| 1995 | -205.000 | -50.363% | 0.130% | N/A |
| 1996 | -158.000 | -22.927% | 0.099% | N/A |
| 1997 | -111.000 | -29.747% | 0.072% | N/A |
| 1998 | -231.000 | 108.108% | 0.130% | N/A |
| 1999 | -276.000 | 19.481% | 0.166% | N/A |
| 2000 | -279.000 | 1.087% | 0.137% | N/A |
| 2001 | -334.000 | 19.713% | 0.169% | N/A |
| 2002 | 323.000 | -196.707% | -0.162% | N/A |
| 2003 | -198.000 | -161.300% | 0.086% | N/A |
| 2004 | -347.000 | 75.253% | 0.149% | N/A |
| 2005 | -653.000 | 88.184% | 0.279% | N/A |
| 2006 | -266.000 | -59.265% | 0.103% | N/A |
| 2007 | -524.000 | 96.992% | 0.193% | N/A |
| 2008 | -125.000 | -76.145% | 0.053% | N/A |
| 2009 | -59.000 | -52.800% | 0.030% | N/A |
| 2010 | -237.000 | 301.695% | 0.103% | N/A |
| 2011 | 203.000 | -185.654% | -0.084% | N/A |
| 2012 | -375.000 | -284.729% | 0.146% | N/A |
| 2013 | -313.000 | -16.533% | 0.119% | N/A |
| 2014 | 457.000 | -246.006% | -0.184% | N/A |
Historical Energy Data about Macedonia
Total Oil Supply
Total Consumption of Petroleum Products
Oil and Petroleum Products, Net Exports/Imports (-)
Dry Natural Gas Consumption
Dry Natural Gas, Net Exports/Imports (-)
Total Primary Coal Production
Total Coal Consumption
Coal, Net Exports/Imports (-)
Total Electricity Net Generation
Total Electricity Net Consumption
Total Electricity Exports
Total Electricity Imports
Electricity, Net Exports/Imports (-)
Total Conventional Thermal Electricity Net Generation
Hydroelectricity Net Generation
Total Biofuels Production
Total Primary Energy Production
Total Primary Energy Consumption
Total Carbon Dioxide Emissions from the Consumption of Energy
Population