| Business / Energy Data |
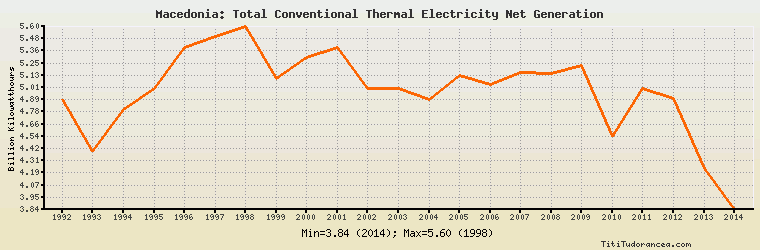
Macedonia: Total Conventional Thermal Electricity Net Generation
Billion Kilowatthours
| Year | Macedonia | Change, percent | Macedonia, percent of Europe | Macedonia, percent of World |
| 1980 | N/A | N/A | N/A | N/A |
| 1981 | N/A | N/A | N/A | N/A |
| 1982 | N/A | N/A | N/A | N/A |
| 1983 | N/A | N/A | N/A | N/A |
| 1984 | N/A | N/A | N/A | N/A |
| 1985 | N/A | N/A | N/A | N/A |
| 1986 | N/A | N/A | N/A | N/A |
| 1987 | N/A | N/A | N/A | N/A |
| 1988 | N/A | N/A | N/A | N/A |
| 1989 | N/A | N/A | N/A | N/A |
| 1990 | N/A | N/A | N/A | N/A |
| 1991 | N/A | N/A | N/A | N/A |
| 1992 | 4.900 | N/A | 0.350% | 0.067% |
| 1993 | 4.400 | -10.204% | 0.323% | 0.060% |
| 1994 | 4.800 | 9.091% | 0.344% | 0.063% |
| 1995 | 5.000 | 4.167% | 0.346% | 0.064% |
| 1996 | 5.400 | 8.000% | 0.359% | 0.067% |
| 1997 | 5.500 | 1.852% | 0.366% | 0.066% |
| 1998 | 5.600 | 1.818% | 0.361% | 0.065% |
| 1999 | 5.100 | -8.929% | 0.325% | 0.058% |
| 2000 | 5.300 | 3.922% | 0.324% | 0.057% |
| 2001 | 5.400 | 1.887% | 0.325% | 0.057% |
| 2002 | 5.000 | -7.407% | 0.293% | 0.050% |
| 2003 | 5.000 | 0.000% | 0.279% | 0.048% |
| 2004 | 4.900 | -2.000% | 0.272% | 0.045% |
| 2005 | 5.126 | 4.612% | 0.283% | 0.045% |
| 2006 | 5.037 | -1.736% | 0.268% | 0.042% |
| 2007 | 5.159 | 2.422% | 0.267% | 0.040% |
| 2008 | 5.143 | -0.310% | 0.269% | 0.040% |
| 2009 | 5.225 | 1.594% | 0.296% | 0.041% |
| 2010 | 4.539 | -13.129% | 0.254% | 0.033% |
| 2011 | 5.006 | 10.289% | 0.285% | 0.035% |
| 2012 | 4.905 | -2.018% | 0.289% | 0.034% |
| 2013 | 4.231 | -13.741% | 0.267% | 0.029% |
| 2014 | 3.837 | -9.312% | 0.257% | 0.026% |
Historical Energy Data about Macedonia
Total Oil Supply
Total Consumption of Petroleum Products
Oil and Petroleum Products, Net Exports/Imports (-)
Dry Natural Gas Consumption
Dry Natural Gas, Net Exports/Imports (-)
Total Primary Coal Production
Total Coal Consumption
Coal, Net Exports/Imports (-)
Total Electricity Net Generation
Total Electricity Net Consumption
Total Electricity Exports
Total Electricity Imports
Electricity, Net Exports/Imports (-)
Total Conventional Thermal Electricity Net Generation
Hydroelectricity Net Generation
Total Biofuels Production
Total Primary Energy Production
Total Primary Energy Consumption
Total Carbon Dioxide Emissions from the Consumption of Energy
Population