| Business / Energy Data |
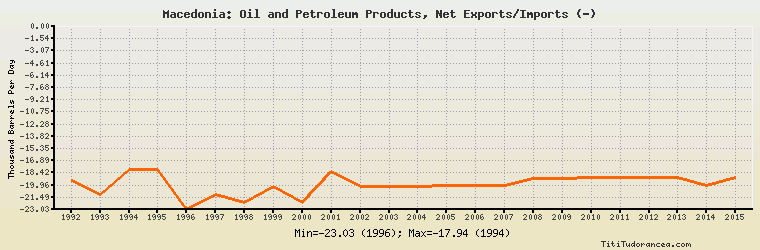
Macedonia: Oil and Petroleum Products, Net Exports/Imports (-)
Thousand Barrels Per Day
| Year | Macedonia | Change, percent | Macedonia, percent of Europe | Macedonia, percent of World |
| 1992 | -19.400 | N/A | 0.202% | N/A |
| 1993 | -21.200 | 9.278% | 0.227% | N/A |
| 1994 | -17.944 | -15.358% | 0.211% | N/A |
| 1995 | -18.012 | 0.379% | 0.212% | N/A |
| 1996 | -23.025 | 27.831% | 0.274% | N/A |
| 1997 | -21.200 | -7.926% | 0.247% | N/A |
| 1998 | -22.100 | 4.245% | 0.248% | N/A |
| 1999 | -20.100 | -9.050% | 0.230% | N/A |
| 2000 | -22.146 | 10.179% | 0.253% | N/A |
| 2001 | -18.190 | -17.863% | 0.205% | N/A |
| 2002 | -20.130 | 10.665% | 0.226% | N/A |
| 2003 | -20.080 | -0.248% | 0.218% | N/A |
| 2004 | -20.078 | -0.010% | 0.207% | N/A |
| 2005 | -20.045 | -0.164% | 0.197% | N/A |
| 2006 | -20.044 | -0.005% | 0.188% | N/A |
| 2007 | -20.066 | 0.110% | 0.186% | N/A |
| 2008 | -19.097 | -4.829% | 0.175% | N/A |
| 2009 | -19.146 | 0.257% | 0.184% | N/A |
| 2010 | -18.980 | -0.867% | 0.177% | N/A |
| 2011 | -19.050 | 0.369% | 0.180% | N/A |
| 2012 | -18.990 | -0.315% | 0.182% | N/A |
| 2013 | -18.990 | 0.000% | 0.182% | N/A |
| 2014 | -19.990 | 5.266% | 0.194% | N/A |
| 2015 | -18.990 | -5.003% | 0.183% | N/A |
Historical Energy Data about Macedonia
Total Oil Supply
Total Consumption of Petroleum Products
Oil and Petroleum Products, Net Exports/Imports (-)
Dry Natural Gas Consumption
Dry Natural Gas, Net Exports/Imports (-)
Total Primary Coal Production
Total Coal Consumption
Coal, Net Exports/Imports (-)
Total Electricity Net Generation
Total Electricity Net Consumption
Total Electricity Exports
Total Electricity Imports
Electricity, Net Exports/Imports (-)
Total Conventional Thermal Electricity Net Generation
Hydroelectricity Net Generation
Total Biofuels Production
Total Primary Energy Production
Total Primary Energy Consumption
Total Carbon Dioxide Emissions from the Consumption of Energy
Population