| Business / Energy Data |
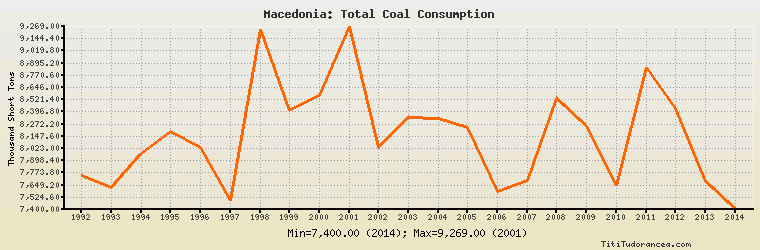
Macedonia: Total Coal Consumption
Thousand Short Tons
| Year | Macedonia | Change, percent | Macedonia, percent of Europe | Macedonia, percent of World |
| 1980 | N/A | N/A | N/A | N/A |
| 1981 | N/A | N/A | N/A | N/A |
| 1982 | N/A | N/A | N/A | N/A |
| 1983 | N/A | N/A | N/A | N/A |
| 1984 | N/A | N/A | N/A | N/A |
| 1985 | N/A | N/A | N/A | N/A |
| 1986 | N/A | N/A | N/A | N/A |
| 1987 | N/A | N/A | N/A | N/A |
| 1988 | N/A | N/A | N/A | N/A |
| 1989 | N/A | N/A | N/A | N/A |
| 1990 | N/A | N/A | N/A | N/A |
| 1991 | N/A | N/A | N/A | N/A |
| 1992 | 7,749.000 | N/A | 0.629% | 0.162% |
| 1993 | 7,622.000 | -1.639% | 0.651% | 0.159% |
| 1994 | 7,975.000 | 4.631% | 0.702% | 0.166% |
| 1995 | 8,196.000 | 2.771% | 0.730% | 0.166% |
| 1996 | 8,034.000 | -1.977% | 0.715% | 0.159% |
| 1997 | 7,496.000 | -6.697% | 0.688% | 0.151% |
| 1998 | 9,243.000 | 23.306% | 0.874% | 0.187% |
| 1999 | 8,406.000 | -9.056% | 0.846% | 0.169% |
| 2000 | 8,564.000 | 1.880% | 0.832% | 0.163% |
| 2001 | 9,269.000 | 8.232% | 0.898% | 0.173% |
| 2002 | 8,033.000 | -13.335% | 0.787% | 0.146% |
| 2003 | 8,335.000 | 3.759% | 0.797% | 0.139% |
| 2004 | 8,333.000 | -0.024% | 0.801% | 0.131% |
| 2005 | 8,238.000 | -1.140% | 0.836% | 0.123% |
| 2006 | 7,584.000 | -7.939% | 0.725% | 0.106% |
| 2007 | 7,699.000 | 1.516% | 0.720% | 0.103% |
| 2008 | 8,536.000 | 10.872% | 0.830% | 0.112% |
| 2009 | 8,245.000 | -3.409% | 0.860% | 0.107% |
| 2010 | 7,649.000 | -7.229% | 0.791% | 0.094% |
| 2011 | 8,846.000 | 15.649% | 0.870% | 0.102% |
| 2012 | 8,433.000 | -4.669% | 0.819% | 0.095% |
| 2013 | 7,683.000 | -8.894% | 0.787% | 0.085% |
| 2014 | 7,400.000 | -3.683% | 0.791% | 0.083% |
Historical Energy Data about Macedonia
Total Oil Supply
Total Consumption of Petroleum Products
Oil and Petroleum Products, Net Exports/Imports (-)
Dry Natural Gas Consumption
Dry Natural Gas, Net Exports/Imports (-)
Total Primary Coal Production
Total Coal Consumption
Coal, Net Exports/Imports (-)
Total Electricity Net Generation
Total Electricity Net Consumption
Total Electricity Exports
Total Electricity Imports
Electricity, Net Exports/Imports (-)
Total Conventional Thermal Electricity Net Generation
Hydroelectricity Net Generation
Total Biofuels Production
Total Primary Energy Production
Total Primary Energy Consumption
Total Carbon Dioxide Emissions from the Consumption of Energy
Population