| Business / Energy Data |
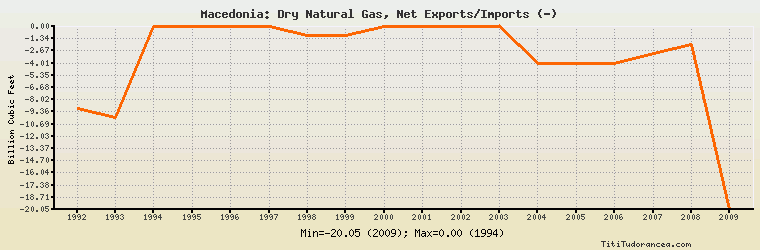
Macedonia: Dry Natural Gas, Net Exports/Imports (-)
Billion Cubic Feet
| Year | Macedonia | Change, percent | Macedonia, percent of Europe | Macedonia, percent of World |
| 1992 | -9.000 | N/A | 0.202% | N/A |
| 1993 | -10.000 | 11.111% | 0.220% | N/A |
| 1994 | 0.000 | -100.000% | 0.00% | N/A |
| 1995 | 0.000 | 0.000% | 0.00% | N/A |
| 1996 | 0.000 | 0.000% | 0.00% | N/A |
| 1997 | 0.000 | 0.000% | 0.00% | N/A |
| 1998 | -1.000 | 0.000% | 0.017% | N/A |
| 1999 | -1.000 | 0.000% | 0.016% | N/A |
| 2000 | 0.000 | -100.000% | 0.00% | N/A |
| 2001 | 0.000 | 0.000% | 0.00% | N/A |
| 2002 | 0.000 | 0.000% | 0.00% | N/A |
| 2003 | 0.000 | 0.000% | 0.00% | N/A |
| 2004 | -4.000 | 0.000% | 0.052% | N/A |
| 2005 | -4.000 | 0.000% | 0.047% | N/A |
| 2006 | -4.000 | 0.000% | 0.045% | N/A |
| 2007 | -3.000 | -25.000% | 0.033% | N/A |
| 2008 | -2.000 | -33.333% | 0.022% | N/A |
| 2009 | -20.051 | 902.550% | 0.236% | N/A |
Historical Energy Data about Macedonia
Total Oil Supply
Total Consumption of Petroleum Products
Oil and Petroleum Products, Net Exports/Imports (-)
Dry Natural Gas Consumption
Dry Natural Gas, Net Exports/Imports (-)
Total Primary Coal Production
Total Coal Consumption
Coal, Net Exports/Imports (-)
Total Electricity Net Generation
Total Electricity Net Consumption
Total Electricity Exports
Total Electricity Imports
Electricity, Net Exports/Imports (-)
Total Conventional Thermal Electricity Net Generation
Hydroelectricity Net Generation
Total Biofuels Production
Total Primary Energy Production
Total Primary Energy Consumption
Total Carbon Dioxide Emissions from the Consumption of Energy
Population