| Business / Energy Data |
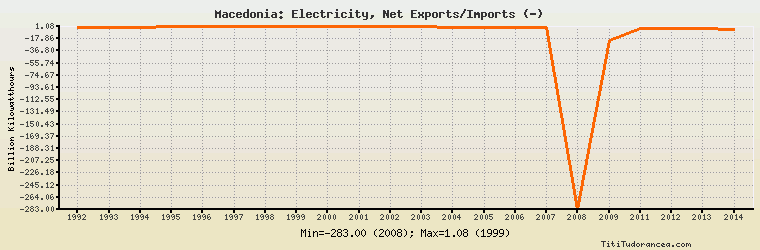
Macedonia: Electricity, Net Exports/Imports (-)
Billion Kilowatthours
| Year | Macedonia | Change, percent | Macedonia, percent of Europe | Macedonia, percent of World |
| 1992 | -0.300 | N/A | 2.689% | N/A |
| 1993 | -0.584 | 94.667% | 5.599% | N/A |
| 1994 | -0.150 | -74.315% | 1.536% | N/A |
| 1995 | 0.701 | -567.333% | -10.788% | N/A |
| 1996 | 0.830 | 18.402% | -11.378% | N/A |
| 1997 | 0.816 | -1.687% | -12.473% | N/A |
| 1998 | 0.868 | 6.373% | -8.634% | N/A |
| 1999 | 1.081 | 24.539% | -27.527% | N/A |
| 2000 | 0.911 | -15.726% | -16.268% | N/A |
| 2001 | 0.719 | -21.076% | -5.530% | N/A |
| 2002 | 0.445 | -38.108% | -3.010% | N/A |
| 2003 | 0.354 | -20.449% | -2.231% | N/A |
| 2004 | 0.201 | -43.220% | -1.698% | N/A |
| 2005 | -0.007 | -103.483% | 0.059% | N/A |
| 2006 | -0.112 | 1,500.000% | 1.084% | N/A |
| 2007 | -0.982 | 776.786% | 9.454% | N/A |
| 2008 | -283.000 | 28,718.737% | 2,230.630% | N/A |
| 2009 | -20.051 | -92.915% | 211.933% | N/A |
| 2011 | -2.676 | -86.654% | 27.968% | N/A |
| 2012 | -2.669 | -0.262% | 87.308% | N/A |
| 2013 | -2.429 | -8.992% | 76.480% | N/A |
| 2014 | -2.960 | 21.861% | -166.386% | N/A |
Historical Energy Data about Macedonia
Total Oil Supply
Total Consumption of Petroleum Products
Oil and Petroleum Products, Net Exports/Imports (-)
Dry Natural Gas Consumption
Dry Natural Gas, Net Exports/Imports (-)
Total Primary Coal Production
Total Coal Consumption
Coal, Net Exports/Imports (-)
Total Electricity Net Generation
Total Electricity Net Consumption
Total Electricity Exports
Total Electricity Imports
Electricity, Net Exports/Imports (-)
Total Conventional Thermal Electricity Net Generation
Hydroelectricity Net Generation
Total Biofuels Production
Total Primary Energy Production
Total Primary Energy Consumption
Total Carbon Dioxide Emissions from the Consumption of Energy
Population