| Business / Energy Data |
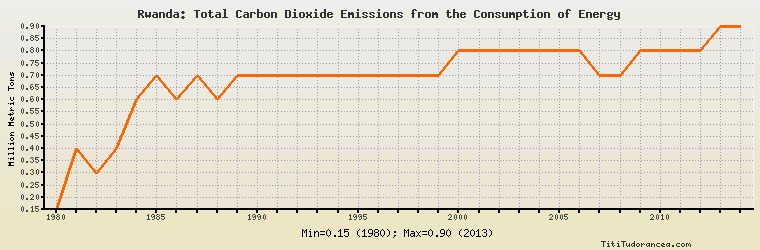
Rwanda: Total Carbon Dioxide Emissions from the Consumption of Energy
Million Metric Tons
| Year | Rwanda | Change, percent | Rwanda, percent of Africa | Rwanda, percent of World |
| 1980 | 0.152 | N/A | 0.029% | 0.001% |
| 1981 | 0.400 | 163.158% | 0.077% | 0.002% |
| 1982 | 0.300 | -25.000% | 0.054% | 0.002% |
| 1983 | 0.400 | 33.333% | 0.068% | 0.002% |
| 1984 | 0.600 | 50.000% | 0.098% | 0.003% |
| 1985 | 0.700 | 16.667% | 0.111% | 0.004% |
| 1986 | 0.600 | -14.286% | 0.092% | 0.003% |
| 1987 | 0.700 | 16.667% | 0.105% | 0.003% |
| 1988 | 0.600 | -14.286% | 0.088% | 0.003% |
| 1989 | 0.700 | 16.667% | 0.099% | 0.003% |
| 1990 | 0.700 | 0.000% | 0.095% | 0.003% |
| 1991 | 0.700 | 0.000% | 0.094% | 0.003% |
| 1992 | 0.700 | 0.000% | 0.093% | 0.003% |
| 1993 | 0.700 | 0.000% | 0.091% | 0.003% |
| 1994 | 0.700 | 0.000% | 0.089% | 0.003% |
| 1995 | 0.700 | 0.000% | 0.085% | 0.003% |
| 1996 | 0.700 | 0.000% | 0.083% | 0.003% |
| 1997 | 0.700 | 0.000% | 0.082% | 0.003% |
| 1998 | 0.700 | 0.000% | 0.081% | 0.003% |
| 1999 | 0.700 | 0.000% | 0.081% | 0.003% |
| 2000 | 0.800 | 14.286% | 0.091% | 0.003% |
| 2001 | 0.800 | 0.000% | 0.089% | 0.003% |
| 2002 | 0.800 | 0.000% | 0.087% | 0.003% |
| 2003 | 0.800 | 0.000% | 0.083% | 0.003% |
| 2004 | 0.800 | 0.000% | 0.080% | 0.003% |
| 2005 | 0.800 | 0.000% | 0.077% | 0.003% |
| 2006 | 0.800 | 0.000% | 0.076% | 0.003% |
| 2007 | 0.700 | -12.500% | 0.065% | 0.002% |
| 2008 | 0.700 | 0.000% | 0.062% | 0.002% |
| 2009 | 0.800 | 14.286% | 0.073% | 0.003% |
| 2010 | 0.800 | 0.000% | 0.069% | 0.003% |
| 2011 | 0.800 | 0.000% | 0.070% | 0.002% |
| 2012 | 0.800 | 0.000% | 0.067% | 0.002% |
| 2013 | 0.900 | 12.500% | 0.073% | 0.003% |
| 2014 | 0.900 | 0.000% | 0.071% | 0.003% |
Historical Energy Data about Rwanda
Total Consumption of Petroleum Products
Oil and Petroleum Products, Net Exports/Imports (-)
Dry Natural Gas, Net Exports/Imports (-)
Proved Reserves of Natural Gas
Coal, Net Exports/Imports (-)
Total Electricity Net Generation
Total Electricity Net Consumption
Total Electricity Exports
Total Electricity Imports
Electricity, Net Exports/Imports (-)
Total Conventional Thermal Electricity Net Generation
Hydroelectricity Net Generation
Total Primary Energy Production
Total Primary Energy Consumption
Total Carbon Dioxide Emissions from the Consumption of Energy
Population