| Business / Energy Data |
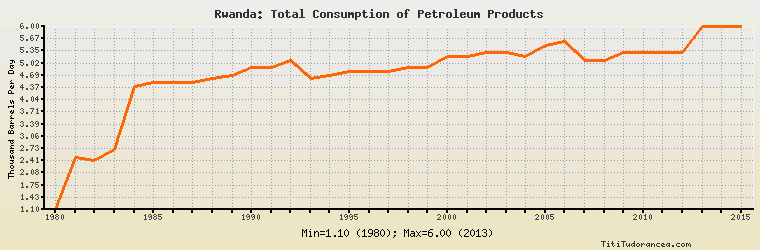
Rwanda: Total Consumption of Petroleum Products
Thousand Barrels Per Day
| Year | Rwanda | Change, percent | Rwanda, percent of Africa | Rwanda, percent of World |
| 1980 | 1.100 | N/A | 0.075% | 0.002% |
| 1981 | 2.500 | 127.273% | 0.158% | 0.004% |
| 1982 | 2.400 | -4.000% | 0.145% | 0.004% |
| 1983 | 2.700 | 12.500% | 0.159% | 0.005% |
| 1984 | 4.400 | 62.963% | 0.250% | 0.007% |
| 1985 | 4.500 | 2.273% | 0.246% | 0.007% |
| 1986 | 4.500 | 0.000% | 0.247% | 0.007% |
| 1987 | 4.500 | 0.000% | 0.245% | 0.007% |
| 1988 | 4.600 | 2.222% | 0.241% | 0.007% |
| 1989 | 4.700 | 2.174% | 0.237% | 0.007% |
| 1990 | 4.900 | 4.255% | 0.237% | 0.007% |
| 1991 | 4.900 | 0.000% | 0.231% | 0.007% |
| 1992 | 5.100 | 4.082% | 0.237% | 0.008% |
| 1993 | 4.600 | -9.804% | 0.211% | 0.007% |
| 1994 | 4.700 | 2.174% | 0.215% | 0.007% |
| 1995 | 4.800 | 2.128% | 0.213% | 0.007% |
| 1996 | 4.800 | 0.000% | 0.208% | 0.007% |
| 1997 | 4.800 | 0.000% | 0.202% | 0.007% |
| 1998 | 4.900 | 2.083% | 0.204% | 0.007% |
| 1999 | 4.900 | 0.000% | 0.200% | 0.006% |
| 2000 | 5.200 | 6.122% | 0.203% | 0.007% |
| 2001 | 5.200 | 0.000% | 0.198% | 0.007% |
| 2002 | 5.300 | 1.923% | 0.196% | 0.007% |
| 2003 | 5.300 | 0.000% | 0.192% | 0.007% |
| 2004 | 5.200 | -1.887% | 0.182% | 0.006% |
| 2005 | 5.500 | 5.769% | 0.185% | 0.006% |
| 2006 | 5.600 | 1.818% | 0.186% | 0.007% |
| 2007 | 5.100 | -8.929% | 0.167% | 0.006% |
| 2008 | 5.100 | 0.000% | 0.160% | 0.006% |
| 2009 | 5.300 | 3.922% | 0.159% | 0.006% |
| 2010 | 5.300 | 0.000% | 0.150% | 0.006% |
| 2011 | 5.300 | 0.000% | 0.154% | 0.006% |
| 2012 | 5.300 | 0.000% | 0.145% | 0.006% |
| 2013 | 6.000 | 13.208% | 0.158% | 0.006% |
| 2014 | 6.000 | 0.000% | 0.150% | 0.006% |
| 2015 | 6.000 | 0.000% | 0.150% | 0.006% |
Historical Energy Data about Rwanda
Total Consumption of Petroleum Products
Oil and Petroleum Products, Net Exports/Imports (-)
Dry Natural Gas, Net Exports/Imports (-)
Proved Reserves of Natural Gas
Coal, Net Exports/Imports (-)
Total Electricity Net Generation
Total Electricity Net Consumption
Total Electricity Exports
Total Electricity Imports
Electricity, Net Exports/Imports (-)
Total Conventional Thermal Electricity Net Generation
Hydroelectricity Net Generation
Total Primary Energy Production
Total Primary Energy Consumption
Total Carbon Dioxide Emissions from the Consumption of Energy
Population