| Business / Demographics |
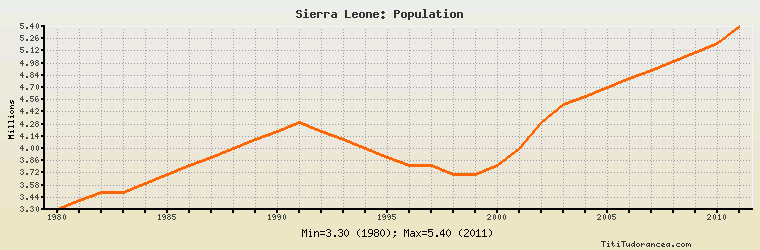
Sierra Leone: Population
Millions
| Year | Sierra Leone | Change, percent | Sierra Leone, percent of Africa | Sierra Leone, percent of World |
| 1980 | 3.300 | N/A | 0.695% | 0.074% |
| 1981 | 3.400 | 3.030% | 0.697% | 0.075% |
| 1982 | 3.500 | 2.941% | 0.690% | 0.076% |
| 1983 | 3.500 | 0.000% | 0.674% | 0.075% |
| 1984 | 3.600 | 2.857% | 0.677% | 0.075% |
| 1985 | 3.700 | 2.778% | 0.675% | 0.076% |
| 1986 | 3.800 | 2.703% | 0.675% | 0.077% |
| 1987 | 3.900 | 2.632% | 0.674% | 0.078% |
| 1988 | 4.000 | 2.564% | 0.672% | 0.078% |
| 1989 | 4.100 | 2.500% | 0.671% | 0.079% |
| 1990 | 4.200 | 2.439% | 0.669% | 0.080% |
| 1991 | 4.300 | 2.381% | 0.668% | 0.080% |
| 1992 | 4.200 | -2.326% | 0.636% | 0.077% |
| 1993 | 4.100 | -2.381% | 0.606% | 0.074% |
| 1994 | 4.000 | -2.439% | 0.575% | 0.071% |
| 1995 | 3.900 | -2.500% | 0.546% | 0.068% |
| 1996 | 3.800 | -2.564% | 0.520% | 0.066% |
| 1997 | 3.800 | 0.000% | 0.508% | 0.065% |
| 1998 | 3.700 | -2.632% | 0.484% | 0.062% |
| 1999 | 3.700 | 0.000% | 0.472% | 0.062% |
| 2000 | 3.800 | 2.703% | 0.472% | 0.062% |
| 2001 | 4.000 | 5.263% | 0.487% | 0.065% |
| 2002 | 4.300 | 7.500% | 0.509% | 0.069% |
| 2003 | 4.500 | 4.651% | 0.520% | 0.071% |
| 2004 | 4.600 | 2.222% | 0.518% | 0.072% |
| 2005 | 4.700 | 2.174% | 0.517% | 0.073% |
| 2006 | 4.800 | 2.128% | 0.515% | 0.073% |
| 2007 | 4.900 | 2.083% | 0.514% | 0.074% |
| 2008 | 5.000 | 2.041% | 0.512% | 0.075% |
| 2009 | 5.100 | 2.000% | 0.510% | 0.075% |
| 2010 | 5.200 | 1.961% | 0.507% | 0.076% |
| 2011 | 5.400 | 3.846% | 0.513% | 0.078% |
Historical Energy Data about Sierra Leone
Total Oil Supply
Total Consumption of Petroleum Products
Oil and Petroleum Products, Net Exports/Imports (-)
Dry Natural Gas, Net Exports/Imports (-)
Coal, Net Exports/Imports (-)
Total Electricity Net Generation
Total Electricity Net Consumption
Electricity, Net Exports/Imports (-)
Total Conventional Thermal Electricity Net Generation
Total Primary Energy Consumption
Total Carbon Dioxide Emissions from the Consumption of Energy
Population