| Business / Energy Data |
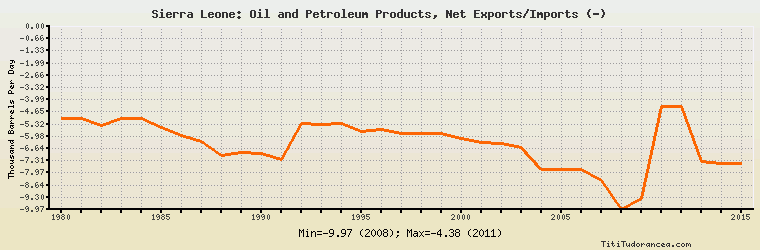
Sierra Leone: Oil and Petroleum Products, Net Exports/Imports (-)
Thousand Barrels Per Day
| Year | Sierra Leone | Change, percent | Sierra Leone, percent of Africa | Sierra Leone, percent of World |
| 1980 | -5.000 | N/A | -0.105% | N/A |
| 1981 | -5.000 | 0.000% | -0.151% | N/A |
| 1982 | -5.400 | 8.000% | -0.168% | N/A |
| 1983 | -5.000 | -7.407% | -0.155% | N/A |
| 1984 | -5.000 | 0.000% | -0.139% | N/A |
| 1985 | -5.500 | 10.000% | -0.146% | N/A |
| 1986 | -5.911 | 7.473% | -0.159% | N/A |
| 1987 | -6.254 | 5.803% | -0.171% | N/A |
| 1988 | -7.040 | 12.568% | -0.179% | N/A |
| 1989 | -6.838 | -2.869% | -0.160% | N/A |
| 1990 | -6.938 | 1.462% | -0.149% | N/A |
| 1991 | -7.238 | 4.324% | -0.150% | N/A |
| 1992 | -5.307 | -26.679% | -0.108% | N/A |
| 1993 | -5.335 | 0.528% | -0.110% | N/A |
| 1994 | -5.300 | -0.656% | -0.109% | N/A |
| 1995 | -5.704 | 7.623% | -0.113% | N/A |
| 1996 | -5.604 | -1.753% | -0.107% | N/A |
| 1997 | -5.804 | 3.569% | -0.107% | N/A |
| 1998 | -5.803 | -0.017% | -0.108% | N/A |
| 1999 | -5.803 | 0.000% | -0.110% | N/A |
| 2000 | -6.102 | 5.153% | -0.112% | N/A |
| 2001 | -6.293 | 3.130% | -0.116% | N/A |
| 2002 | -6.399 | 1.684% | -0.118% | N/A |
| 2003 | -6.596 | 3.079% | -0.113% | N/A |
| 2004 | -7.799 | 18.238% | -0.121% | N/A |
| 2005 | -7.797 | -0.026% | -0.110% | N/A |
| 2006 | -7.771 | -0.333% | -0.108% | N/A |
| 2007 | -8.375 | 7.772% | -0.113% | N/A |
| 2008 | -9.967 | 19.009% | -0.135% | N/A |
| 2009 | -9.371 | -5.980% | -0.132% | N/A |
| 2011 | -4.375 | -53.313% | -0.075% | N/A |
| 2012 | -4.375 | 0.000% | -0.070% | N/A |
| 2013 | -7.375 | 68.571% | -0.135% | N/A |
| 2014 | -7.475 | 1.356% | -0.157% | N/A |
| 2015 | -7.475 | 0.000% | -0.161% | N/A |
Historical Energy Data about Sierra Leone
Total Oil Supply
Total Consumption of Petroleum Products
Oil and Petroleum Products, Net Exports/Imports (-)
Dry Natural Gas, Net Exports/Imports (-)
Coal, Net Exports/Imports (-)
Total Electricity Net Generation
Total Electricity Net Consumption
Electricity, Net Exports/Imports (-)
Total Conventional Thermal Electricity Net Generation
Total Primary Energy Consumption
Total Carbon Dioxide Emissions from the Consumption of Energy
Population