| Business / Energy Data |
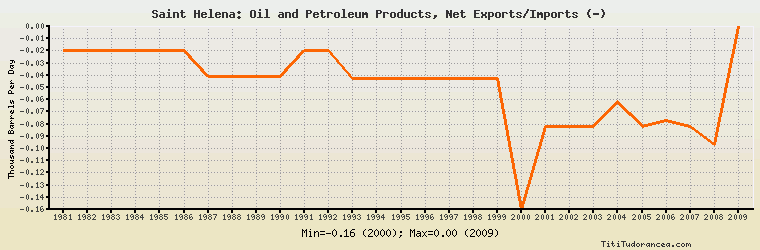
Saint Helena: Oil and Petroleum Products, Net Exports/Imports (-)
Thousand Barrels Per Day
| Year | Saint Helena | Change, percent | Saint Helena, percent of Africa | Saint Helena, percent of World |
| 1981 | -0.020 | N/A | -0.001% | N/A |
| 1982 | -0.020 | 0.000% | -0.001% | N/A |
| 1983 | -0.020 | 0.000% | -0.001% | N/A |
| 1984 | -0.020 | 0.000% | -0.001% | N/A |
| 1985 | -0.020 | 0.000% | -0.001% | N/A |
| 1986 | -0.020 | 0.000% | -0.001% | N/A |
| 1987 | -0.042 | 110.000% | -0.001% | N/A |
| 1988 | -0.042 | 0.000% | -0.001% | N/A |
| 1989 | -0.042 | 0.000% | -0.001% | N/A |
| 1990 | -0.042 | 0.000% | -0.001% | N/A |
| 1991 | -0.020 | -52.381% | -0.000% | N/A |
| 1992 | -0.020 | 0.000% | -0.000% | N/A |
| 1993 | -0.044 | 120.000% | -0.001% | N/A |
| 1994 | -0.044 | 0.000% | -0.001% | N/A |
| 1995 | -0.044 | 0.000% | -0.001% | N/A |
| 1996 | -0.044 | 0.000% | -0.001% | N/A |
| 1997 | -0.044 | 0.000% | -0.001% | N/A |
| 1998 | -0.044 | 0.000% | -0.001% | N/A |
| 1999 | -0.044 | 0.000% | -0.001% | N/A |
| 2000 | -0.155 | 252.273% | -0.003% | N/A |
| 2001 | -0.085 | -45.161% | -0.002% | N/A |
| 2002 | -0.085 | 0.000% | -0.002% | N/A |
| 2003 | -0.085 | 0.000% | -0.001% | N/A |
| 2004 | -0.064 | -24.706% | -0.001% | N/A |
| 2005 | -0.085 | 32.813% | -0.001% | N/A |
| 2006 | -0.080 | -5.882% | -0.001% | N/A |
| 2007 | -0.085 | 6.250% | -0.001% | N/A |
| 2008 | -0.100 | 17.647% | -0.001% | N/A |
| 2009 | 0.000 | -100.000% | 0.00% | N/A |
Historical Energy Data about Saint Helena
Total Consumption of Petroleum Products
Oil and Petroleum Products, Net Exports/Imports (-)
Total Electricity Net Generation
Total Electricity Net Consumption
Electricity, Net Exports/Imports (-)
Total Conventional Thermal Electricity Net Generation
Total Carbon Dioxide Emissions from the Consumption of Energy
Population