| Business / Energy Data |
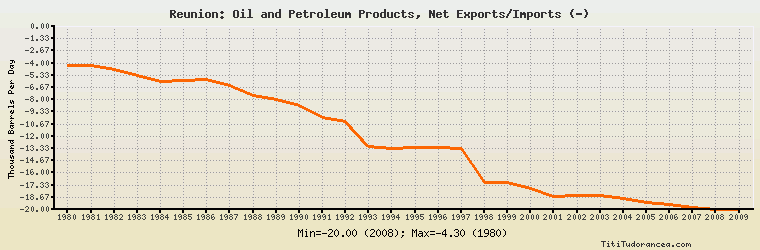
Reunion: Oil and Petroleum Products, Net Exports/Imports (-)
Thousand Barrels Per Day
| Year | Reunion | Change, percent | Reunion, percent of Africa | Reunion, percent of World |
| 1980 | -4.300 | N/A | -0.090% | N/A |
| 1981 | -4.300 | 0.000% | -0.130% | N/A |
| 1982 | -4.700 | 9.302% | -0.146% | N/A |
| 1983 | -5.400 | 14.894% | -0.168% | N/A |
| 1984 | -6.000 | 11.111% | -0.167% | N/A |
| 1985 | -5.905 | -1.583% | -0.157% | N/A |
| 1986 | -5.826 | -1.338% | -0.157% | N/A |
| 1987 | -6.395 | 9.767% | -0.175% | N/A |
| 1988 | -7.506 | 17.373% | -0.191% | N/A |
| 1989 | -7.962 | 6.075% | -0.186% | N/A |
| 1990 | -8.629 | 8.377% | -0.186% | N/A |
| 1991 | -9.912 | 14.868% | -0.205% | N/A |
| 1992 | -10.384 | 4.762% | -0.211% | N/A |
| 1993 | -13.135 | 26.493% | -0.270% | N/A |
| 1994 | -13.373 | 1.812% | -0.276% | N/A |
| 1995 | -13.261 | -0.838% | -0.262% | N/A |
| 1996 | -13.265 | 0.030% | -0.254% | N/A |
| 1997 | -13.367 | 0.769% | -0.246% | N/A |
| 1998 | -17.010 | 27.254% | -0.316% | N/A |
| 1999 | -17.010 | 0.000% | -0.322% | N/A |
| 2000 | -17.725 | 4.203% | -0.326% | N/A |
| 2001 | -18.535 | 4.570% | -0.343% | N/A |
| 2002 | -18.492 | -0.232% | -0.341% | N/A |
| 2003 | -18.500 | 0.043% | -0.316% | N/A |
| 2004 | -18.818 | 1.719% | -0.291% | N/A |
| 2005 | -19.204 | 2.051% | -0.270% | N/A |
| 2006 | -19.436 | 1.208% | -0.270% | N/A |
| 2007 | -19.739 | 1.559% | -0.266% | N/A |
| 2008 | -20.000 | 1.322% | -0.271% | N/A |
| 2009 | -20.000 | 0.000% | -0.282% | N/A |
Historical Energy Data about Reunion
Total Consumption of Petroleum Products
Oil and Petroleum Products, Net Exports/Imports (-)
Dry Natural Gas, Net Exports/Imports (-)
Coal, Net Exports/Imports (-)
Total Electricity Net Generation
Total Electricity Net Consumption
Electricity, Net Exports/Imports (-)
Total Conventional Thermal Electricity Net Generation
Hydroelectricity Net Generation
Total Primary Energy Production
Total Primary Energy Consumption
Total Carbon Dioxide Emissions from the Consumption of Energy