| Business / Energy Data |
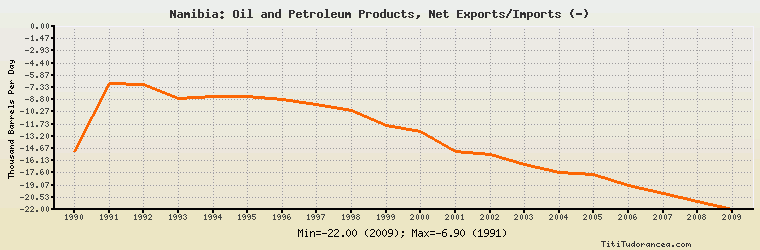
Namibia: Oil and Petroleum Products, Net Exports/Imports (-)
Thousand Barrels Per Day
| Year | Namibia | Change, percent | Namibia, percent of Africa | Namibia, percent of World |
| 1990 | -15.000 | N/A | -0.323% | N/A |
| 1991 | -6.898 | -54.013% | -0.143% | N/A |
| 1992 | -7.028 | 1.885% | -0.143% | N/A |
| 1993 | -8.667 | 23.321% | -0.178% | N/A |
| 1994 | -8.374 | -3.381% | -0.173% | N/A |
| 1995 | -8.374 | 0.000% | -0.165% | N/A |
| 1996 | -8.827 | 5.410% | -0.169% | N/A |
| 1997 | -9.374 | 6.197% | -0.172% | N/A |
| 1998 | -10.074 | 7.467% | -0.187% | N/A |
| 1999 | -11.862 | 17.749% | -0.225% | N/A |
| 2000 | -12.631 | 6.483% | -0.233% | N/A |
| 2001 | -15.051 | 19.159% | -0.278% | N/A |
| 2002 | -15.417 | 2.432% | -0.284% | N/A |
| 2003 | -16.636 | 7.907% | -0.284% | N/A |
| 2004 | -17.579 | 5.668% | -0.272% | N/A |
| 2005 | -17.745 | 0.944% | -0.249% | N/A |
| 2006 | -19.117 | 7.732% | -0.266% | N/A |
| 2007 | -20.114 | 5.215% | -0.271% | N/A |
| 2008 | -21.000 | 4.405% | -0.284% | N/A |
| 2009 | -22.000 | 4.762% | -0.310% | N/A |
Historical Energy Data about Namibia
Total Consumption of Petroleum Products
Oil and Petroleum Products, Net Exports/Imports (-)
Dry Natural Gas, Net Exports/Imports (-)
Proved Reserves of Natural Gas
Total Coal Consumption
Coal, Net Exports/Imports (-)
Total Electricity Net Generation
Total Electricity Net Consumption
Total Electricity Exports
Total Electricity Imports
Electricity, Net Exports/Imports (-)
Total Conventional Thermal Electricity Net Generation
Hydroelectricity Net Generation
Total Primary Energy Production
Total Primary Energy Consumption
Total Carbon Dioxide Emissions from the Consumption of Energy
Population