| Business / Energy Data |
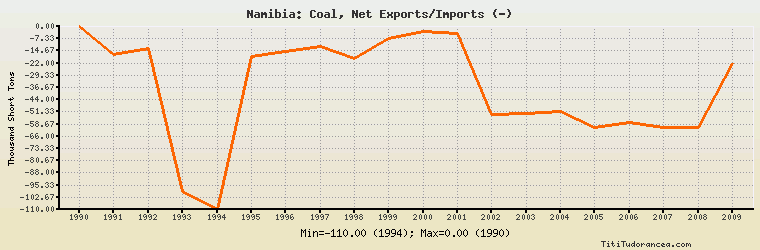
Namibia: Coal, Net Exports/Imports (-)
Thousand Short Tons
| Year | Namibia | Change, percent | Namibia, percent of Africa | Namibia, percent of World |
| 1990 | 0.000 | N/A | 0.00% | N/A |
| 1991 | -17.000 | 0.000% | -0.032% | N/A |
| 1992 | -13.000 | -23.529% | -0.026% | N/A |
| 1993 | -99.000 | 661.538% | -0.163% | N/A |
| 1994 | -110.000 | 11.111% | -0.167% | N/A |
| 1995 | -18.000 | -83.636% | -0.027% | N/A |
| 1996 | -15.000 | -16.667% | -0.025% | N/A |
| 1997 | -12.000 | -20.000% | -0.018% | N/A |
| 1998 | -19.000 | 58.333% | -0.028% | N/A |
| 1999 | -7.000 | -63.158% | -0.009% | N/A |
| 2000 | -3.000 | -57.143% | -0.004% | N/A |
| 2001 | -4.000 | 33.333% | -0.006% | N/A |
| 2002 | -53.000 | 1,225.000% | -0.088% | N/A |
| 2003 | -52.000 | -1.887% | -0.075% | N/A |
| 2004 | -51.000 | -1.923% | -0.080% | N/A |
| 2005 | -61.000 | 19.608% | -0.081% | N/A |
| 2006 | -58.000 | -4.918% | -0.091% | N/A |
| 2007 | -61.000 | 5.172% | -0.100% | N/A |
| 2008 | -61.000 | 0.000% | -0.097% | N/A |
| 2009 | -22.000 | -63.934% | -0.031% | N/A |
Historical Energy Data about Namibia
Total Consumption of Petroleum Products
Oil and Petroleum Products, Net Exports/Imports (-)
Dry Natural Gas, Net Exports/Imports (-)
Proved Reserves of Natural Gas
Total Coal Consumption
Coal, Net Exports/Imports (-)
Total Electricity Net Generation
Total Electricity Net Consumption
Total Electricity Exports
Total Electricity Imports
Electricity, Net Exports/Imports (-)
Total Conventional Thermal Electricity Net Generation
Hydroelectricity Net Generation
Total Primary Energy Production
Total Primary Energy Consumption
Total Carbon Dioxide Emissions from the Consumption of Energy
Population