| Business / Energy Data |
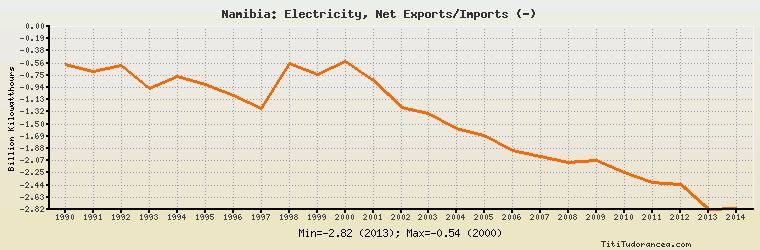
Namibia: Electricity, Net Exports/Imports (-)
Billion Kilowatthours
| Year | Namibia | Change, percent | Namibia, percent of Africa | Namibia, percent of World |
| 1990 | -0.586 | N/A | 120.082% | N/A |
| 1991 | -0.700 | 19.454% | 299.145% | N/A |
| 1992 | -0.600 | -14.286% | -405.405% | N/A |
| 1993 | -0.951 | 58.500% | 1,864.706% | N/A |
| 1994 | -0.772 | -18.822% | 612.698% | N/A |
| 1995 | -0.900 | 16.580% | -197.802% | N/A |
| 1996 | -1.070 | 18.889% | -60.350% | N/A |
| 1997 | -1.270 | 18.692% | -80.533% | N/A |
| 1998 | -0.577 | -54.567% | 16.364% | N/A |
| 1999 | -0.744 | 28.943% | 30.195% | N/A |
| 2000 | -0.535 | -28.091% | 14.236% | N/A |
| 2001 | -0.835 | 56.075% | 30.342% | N/A |
| 2002 | -1.246 | 49.222% | 68.612% | N/A |
| 2003 | -1.347 | 8.106% | 42.980% | N/A |
| 2004 | -1.577 | 17.075% | 96.100% | N/A |
| 2005 | -1.672 | 6.024% | 75.588% | N/A |
| 2006 | -1.912 | 14.354% | 47.059% | N/A |
| 2007 | -2.005 | 4.864% | 43.758% | N/A |
| 2008 | -2.100 | 4.738% | 49.728% | N/A |
| 2009 | -2.058 | -2.000% | 47.749% | N/A |
| 2010 | -2.255 | 9.572% | 62.465% | N/A |
| 2011 | -2.404 | 6.608% | 51.062% | N/A |
| 2012 | -2.428 | 0.998% | 38.345% | N/A |
| 2013 | -2.818 | 16.063% | 35.514% | N/A |
| 2014 | -2.802 | -0.568% | 40.369% | N/A |
Historical Energy Data about Namibia
Total Consumption of Petroleum Products
Oil and Petroleum Products, Net Exports/Imports (-)
Dry Natural Gas, Net Exports/Imports (-)
Proved Reserves of Natural Gas
Total Coal Consumption
Coal, Net Exports/Imports (-)
Total Electricity Net Generation
Total Electricity Net Consumption
Total Electricity Exports
Total Electricity Imports
Electricity, Net Exports/Imports (-)
Total Conventional Thermal Electricity Net Generation
Hydroelectricity Net Generation
Total Primary Energy Production
Total Primary Energy Consumption
Total Carbon Dioxide Emissions from the Consumption of Energy
Population