| Business / Energy Data |
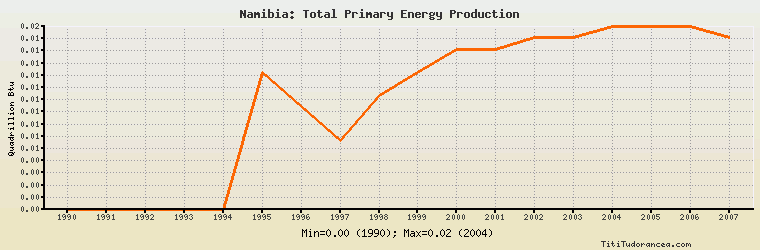
Namibia: Total Primary Energy Production
Quadrillion Btu
| Year | Namibia | Change, percent | Namibia, percent of Africa | Namibia, percent of World |
| 1980 | N/A | N/A | N/A | N/A |
| 1981 | N/A | N/A | N/A | N/A |
| 1982 | N/A | N/A | N/A | N/A |
| 1983 | N/A | N/A | N/A | N/A |
| 1984 | N/A | N/A | N/A | N/A |
| 1985 | N/A | N/A | N/A | N/A |
| 1986 | N/A | N/A | N/A | N/A |
| 1987 | N/A | N/A | N/A | N/A |
| 1988 | N/A | N/A | N/A | N/A |
| 1989 | N/A | N/A | N/A | N/A |
| 1990 | 0.000 | N/A | 0.00% | 0.00% |
| 1991 | 0.000 | 0.000% | 0.00% | 0.00% |
| 1992 | 0.000 | 0.000% | 0.00% | 0.00% |
| 1993 | 0.000 | 0.000% | 0.00% | 0.00% |
| 1994 | 0.000 | 0.000% | 0.00% | 0.00% |
| 1995 | 0.012 | 0.000% | 0.051% | 0.003% |
| 1996 | 0.009 | -25.000% | 0.037% | 0.002% |
| 1997 | 0.006 | -33.333% | 0.024% | 0.002% |
| 1998 | 0.010 | 66.667% | 0.039% | 0.003% |
| 1999 | 0.012 | 20.000% | 0.046% | 0.003% |
| 2000 | 0.014 | 16.667% | 0.052% | 0.004% |
| 2001 | 0.014 | 0.000% | 0.052% | 0.004% |
| 2002 | 0.015 | 7.143% | 0.055% | 0.004% |
| 2003 | 0.015 | 0.000% | 0.051% | 0.004% |
| 2004 | 0.016 | 6.667% | 0.052% | 0.004% |
| 2005 | 0.016 | 0.000% | 0.049% | 0.004% |
| 2006 | 0.016 | 0.000% | 0.048% | 0.004% |
| 2007 | 0.015 | -6.250% | 0.044% | 0.003% |
| 2008 | N/A | N/A | N/A | N/A |
| 2009 | N/A | N/A | N/A | N/A |
| 2010 | N/A | N/A | N/A | N/A |
Historical Energy Data about Namibia
Total Consumption of Petroleum Products
Oil and Petroleum Products, Net Exports/Imports (-)
Dry Natural Gas, Net Exports/Imports (-)
Proved Reserves of Natural Gas
Total Coal Consumption
Coal, Net Exports/Imports (-)
Total Electricity Net Generation
Total Electricity Net Consumption
Total Electricity Exports
Total Electricity Imports
Electricity, Net Exports/Imports (-)
Total Conventional Thermal Electricity Net Generation
Hydroelectricity Net Generation
Total Primary Energy Production
Total Primary Energy Consumption
Total Carbon Dioxide Emissions from the Consumption of Energy
Population